Characterization of Morphology and Defects in Silicon-Germanium Virtual Substrates
- PDF / 1,899,402 Bytes
- 6 Pages / 415.8 x 637.2 pts Page_size
- 73 Downloads / 343 Views
Mat. Res. Soc. Symp. Proc. Vol. 618 © 2000 Materials Research Society
devices on Si [6], all of which require layers with good surface morphology and reduced defect density. Different growth techniques have been used for the deposition of these layers and different methods for improving the quality of the virtual substrates have been reported. We are reporting results obtained from the comparison between Si-Ge heterostructures incorporating two different types of virtual substrates (characterised by linear and step-graded variation of the Ge concentration, respectively) grown by LPCVD at the Southampton University Microelectronics Centre. For the same growth conditions, the step-graded virtual substrate exhibited superior properties compared to the linear-graded one. EXPERIMENT Two different heterostructures consisting of a SiixGex virtual substrate of graded Ge, concentration between 12 ± 1 % and 42 ± 1% over 1.36 ýirn of thickness (linear and in 5 steps of 6 %) grown on a 4-inch (001) Si wafer and capped with a 0.24 ýtm Si-Ge layer of constant composition, as represented schematically in figure 1, were analysed. Both heterostructures were grown in a cold-wall Ultra High Vacuum (UHV)-compatible single wafer system by LPCVD using H2 , Sill4 and GeH 4. The temperature was kept constant during growth. The virtual substrate growth rate variation is represented in figure 2. Ge concentrations were estimated from High Resolution X-Ray Diffraction (HRXRD) results and the thicknesses of the different constituent layers in the heterostructures were determined by Secondary Ion Mass Spectroscopy (SIMS). An initial assessment of the surface morphology and measurement of the lateral spacing of the surface features was carried out using Nomarski Differential Interference Contrast Microscopy. Atomic Force Microscopy (AFM) provided quantitative information on the average height and the Root Mean Square (RMS) of the surface roughness. Bright-field cross-sectional Transmission Electron Microscopy (XTEM) in different two-beam conditions was used for defect analysis.
Sio.58Geo,42 capping
0.4 i
layer of constant composition an SilGvGeu virtual with a substrate linear/step-graded Ge
.•1.36 [im
concentration ZZ (001) Si substrate
525 rtm • (1 sbawafer
266
Figure 1. Schematic diagram of the Si-Ge heterostructures analysed, consisting of a Sii-,,Ge, virtual substrate of graded Ge concentration (linear and in 5 steps of 6 %, respectively) grown on a 4-inch (001) Si and capped with a Si-Ge layer of constant composition.
1200 1000 NI
S800 S600
S400 200 0 0
13.3
18.7
34.2 29.8 24.4 Ge (%)from XRD data
38.6
41.5
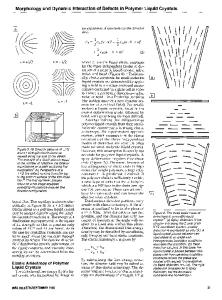
Figure 2. The virtual substrate growth rate shows a small variation at the beginning of the growth and is almost constant subsequently. RESULTS The analysed heterostructures exhibit, to varying degrees, periodic undulations on their surfaces along two perpendicular directions, i.e. along the same directions as the underlying misfit dislocations, creating the typically known crosshatch pattern. Some of the crosshatch
Data Loading...