Concentration Dependence of Hydrogen Diffusion in Hydrogenated Silicon
- PDF / 413,314 Bytes
- 6 Pages / 414.72 x 648 pts Page_size
- 1 Downloads / 359 Views
Mat. Res. Soc. Symp. Proc. Vol. 507 © 1998 Materials Research Society
"1021
n.a
H
Z "X.10,:400C,3 1019 D\I
10-1 c:1
r
10-2 I10-3
(a)
I01•
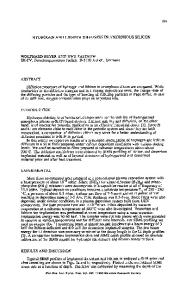
Fig. 1. (a) Depth profiles of hydrogen and deuterium and (b) normalized deuterium concentration versus depth for deuterium-implanted implantation-hydrogenated c-Si:H cH z 1.5 at. % prior (n.a.) and after annealing. Error function fit is indicated by dotted line [6].
10-1 --
Z - 10 -2
T 400"C 3h
na.
V(b)of 10-3
0
,
0.2
,_____
0.4
06 d(pm)
_,
08
10
2x10 15 cm' 2). The solid lines in Fig. la refer to the as-deposited sample. It is seen that for the implantation conditions applied the hydrogen concentration is not entirely constant but shows some modulation as a function of depth (solid line). Upon annealing, the implanted deuterium spreads (dashed line) and the deuterium profile shows a similar modulation as the hydrogen profile. In Fig. lb, the deuterium density is normalized to the total (hydrogen plus deuterium) concentration. The concentration modulation of hydrogen and deuterium in the annealed state is seen to disappear, resulting in an error function type depth dependence as indicated by the dotted line. By fits of such curves with complementary error functions or superpositions of error functions the hydrogen diffusion coefficient is obtained. As the we measured the diffusion coefficient diffusion coefficient showed some time-dependence, for a fixed diffusion length of L = 2(D t 11 2 z 2x10⁻¹ cm. As demonstrated previously [6], the H diffusion coefficient in the IH Si:H material is found to follow an Arrhenius dependence D = Do exp (-ED/kT) (with k the Boltzmann constant) in all cases. In Fig. 2, the diffusion parameters Do and ED along with the diffusion coefficient at T=400'C are plotted as a function of (average) hydrogen density NH in the hydrogen diffusion zone. Fig. 2a shows data for IH c-Si:H, Fig. 2b for a-Si:H (solid dots). Also plotted in Fig. 2b are results for as-deposited (rf) plasma-grown a-Si:H films [2,3] grown by using undiluted silane at Ts> 150'C, effused a-Si:H samples, an a-Si:H film grown by (rf) plasma at T = 50'C using silane diluted 1:10 in hydrogen and (compact) /Lc-Si:H samples. It is seen that }or a hydrogen density of about (2-3)x10 21cm 3 the diffusion coefficient in IH aSi:H and IH c-Si:H is quite similar, both in absolute value and in activation energy. This is in agreement with our previous results [7] and with recent data by Nickel and co-workers [8]. Yet, there is an opposite concentration dependence: While for IH c-Si:H the diffusion coefficient at 400'C decreases with rising hydrogen density and concentration, an increase of the diffusion coefficient of both our plasma-grown and IH a-Si:H films in agreement with literature data by Shinar et al. [9] is observed. A similar opposite concentration dependence is found for the diffusion energy which increases slightly for c-Si:H but decreases rapidly for a-Si:H as the hydrogen density rises. The diffusion prefactor decreases with increasing hydrogen concentration for b
Data Loading...