Correlation Between Electrical Properties and Composition / Microstructure of Si-C-N Ceramics
- PDF / 1,942,699 Bytes
- 6 Pages / 414.72 x 648 pts Page_size
- 25 Downloads / 277 Views
rp., Japan 285 Mat. Res. Soc. Symp. Proc. Vol. 500 ©1998 Materials Research Society
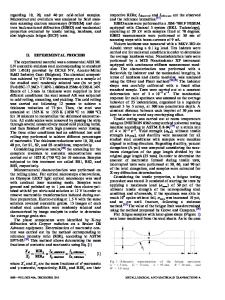
Germany. The CK-spectra were obtained by using a high-energy toroidal grating monochromator in the electron yield mode. The energy range of the incident radiation was 270 - 330 eV, the resolution about 10- 3. Raman spectra at room temperature were recorded by a RFA 106 Raman accessory, Bruker, Germany. The Laser excitation was supplied by a Nd:YAG laser, operating with an average power of about 100 mW. Microstructural characterization was performed by transmission electron microscopy using a JEOL 4000 EX microscope, operating at 400 kV. The point resolution was 0.17 nm. For analytic characterization an electron energy-loss spectrometer (PEELS, Gatan 666) fitted to the microscope was used. Under optimized working conditions, an energy resolution of 0.80 eV was achieved. Finally, x-ray powder diffractometry was performed on a D 5000 powder diffractometer, Siemens, Germany. RESULTS Fig. 1 represents the electrical conductivity (Yd.c. measured at room temperature depending on the temperature and time of the heat-treatment in N2. Gd.c. increases with temperature by several orders of magnitude. Related to the phase composition, 3 temperature regions can be distinguished.
S. 0 L0
.
10410-2-
10-6106-
-0-
25h/N2
SIII
.
50h/N2
II
1-8-9
10 10
I1
a-SiCN:H
II
.
.
.
.
.
a•-SiC:N•
a-SiC(N) Cal/P-SiC a -Si3N4
7 10o10-S10
II
,
- 10hlN2
1047
t:)
,
Si-.C-N
CN 10-3-
E
•
..
C .
.
!
.
.
.
I
•
•
1000 1100 1200 1300 1400 1500 1600 1700
annealing temperature Ta [°C] Fig. 1
Electrical conductivity (d.c., T = 25 C)Y of Si-C-N ceramics depending on the time and temperature of the heat-treatment in N2.
In region I there exists only amorphous silicon carbonitride, which contains residual hydrogen (a-SiCN:H). It is assumed that the change of hybridization of the carbon causes the high increase of Gd.c in the temperature range up to 1300 0C. XANES-spectroscopy at the CK-edge shows an increasing content of sp -hybridized carbon (7t*-resonance at 285 eV characteristic for C=C bonds [7]) with increasing temperature (Fig. 2). In addition, the amount of C-H bonds (characteristic resonance at 288 eV [7]) is decreasing. The H-content measured by the 15N-method showed a decrease from 5 at.% to 286
1 at.% in theandsame Thisforcorrelation sp2hybridization ad.c. istemperature similar to thatrange. reported amorphous between C and SiCH-content, [8-10].
S*
* (C-H)
-ceramics
-in (C=C) •
Sy
1300 °C 1 50 h / N2
i
1100 °C 1 10 h I N2
•.-
pyrolysed sample
284
286
288
290
292 294 energy [eV]
287
296
298
300
In the temperature region above 1300 °C, a pronounced increase of the conductivity can be measured. While the formation of Si3N4 has no influence on ad.c., nanocrystalline SiC-particles (Fig. 3) are assumed to be responsible for the high rise in conductivity due to the formation of conducting percolation paths. 20
1.
1
Si,
SiLl
3
C. 1350
CD
°C
'-'10-
•
NK
0
100
200
300
400
500
energy loss [eV]
Data Loading...