Corrosion Behavior of Pyrochlore-Rich Titanate Ceramics For Plutonium Disposition; Impurity Effects
- PDF / 2,655,229 Bytes
- 8 Pages / 381.06 x 606.06 pts Page_size
- 65 Downloads / 335 Views
181 Mat. Res. Soc. Symp. Proc. Vol. 556 ©1999 Materials Research Society
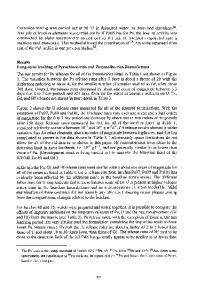
RESULTS AND DISCUSSION Test Materials Four ceramics fabricated at Lawrence Livermore National Laboratory are included in this study (Table 1). These ceramics were sintered at 1325°C; see reference2 for further details of the fabrication process. One of the ceramics was the baseline composition. The other ceramics contained the impurity mixtures shown in Table 1. Note that the "high" ceramic contains an amount of impurities in excess of that expected in the actual feed. Each ceramic was examined with SEM and TEM to describe the phase assemblages. Figure 1 shows SEM micrographs of each ceramic. Four major phases were observed in the baseline (Figure la): pyrochlore (CaHfTi 27O ), zirconolite (CaHfTi 2O7), brannerite (UTi 206), and rutile (TiO2 ). While the nominal chemical formulae of pyrochlore and zirconolite are identical, their crystal structures are 3 distinct . In these ceramics, the zirconolite was identified by its morphology (needles) and its relative
U/Hf ratio (lower than pyrochlore). The impurity ceramics also contained a small amount of an amorphous silicate containing primarily Al, Si, Ca, Ti, Ga, and Mo (according to EDS). Calcium and cerium phosphate crystals were present within the silicate phase found in all of the impurity ceramics. The composition of the silicate and the Ca-Ce phosphate are similar in all of the impurity ceramics. The "high" ceramic also contained perovskite (CaTiO 3), and a Ca-Al-Ti crystalline phase. Figure Id shows a typical area of the "high" impurity ceramic, containing some Ca-Al-Ti phase and perovskite. Figure le shows an area of the "high" impurity ceramic containing relatively large amounts of perovskite and the Ca-Al-Ti phase. Table 1. Batch compositions of the ceramics tested, in elemental mass % Baseline Low Medium High Ca 7.2 7.2 7.2 7.6 Ti 22 21 21 19 Ce 6.2 6.1 5.9 5.3 Gd 6.2 6.1 6.6 6.0 Hf 9.1 9.0 8.6 7.8 U 21 21 20 18 0 28 29 28 28 B 0.049 0.050 0.11 F 0.060 0.22 0.63 Na 0.046 0.10 0.35 Mg 0.078 0.26 0.52 Al 0.17 0.27 0.84 Si 0.088 0.21 0.69 Cl 0.10 0.43 1.39 K 0.056 0.27 0.87 Cr 0.014 0.052 0.089 Fe 0.060 0.11 0.35 Ni 0.031 0.10 0.26 Zn 0.010 0.05 Ga 0.10 0.43 Mo 0.080 0.22 0.35 Ta 0.050 0.16 0.52 W 0.42 1.4 Impurities 0.0 0.99 3.4 8.4 *-calculated by difference
182
Pyrochlore
Brannerit
t
Por
Figure Ia. SEM micrograph (backscatter emission) of a polished surface of the baseline ceramic.
Zirconolite
Figure lb. SEM micrograph (backscatter emission) of a polished surface of the "low" ceramic.
183
Pyrochlore
-
Pore
Zirconolite - Silicate
Rutile
-
Figure Ic. SEM micrograph (backscatter emission) of a polished surface of the "medium" ceramic.
T Pyrochlore '-- Pore
-Silicate -Zirconolite
-Perovskite -
Figure Id. SEM micrograph (backscatter emission) of a polished surface of the "high" ceramic.
184
Ca-AI-Ti
Pyrochlore
IZirconolite
Perovsklte
Ca-Al-TI Phase
Phase
Figure le. SEM micrograph (backscatter emission) of a polished surface of the "high" ceramic. Normalized
Data Loading...