Crystallinity Effects in the Optical Modulation of Electrochromic Devices
- PDF / 306,508 Bytes
- 6 Pages / 414.72 x 648 pts Page_size
- 95 Downloads / 312 Views
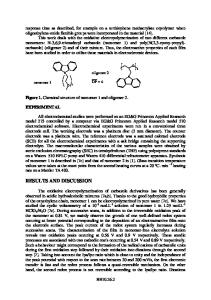
RESULTS AND DISCUSSION Electrochemical differences to be expected between crystalline and amorphous films include speed and shape. The 10 mV/sec cyclic voltammograms obtained from a-WO 3 and c-WO 3 thin films are shown in Figure 1. As evidenced by the higher current levels observed for the amorphous films, a-WO 3 is faster than c-WO 3. The kinetic difference is also responsible for the non-zero current of the c-W0 3 sample at the bleaching limit of +0.8 volts. A more subtle difference is the discernible peak at 0 volts in the positive current portion of the c-W0 3 trace. This indicates that the electrochemical potentials of extraction are better defined in the crystalline material. Despite the kinetic differences, both films can be reversibly colored and bleached. 3-
-a-W0 3
2, 1
-3
S,'
-4 -0.6
-0.4
-0.2
10 mV/sec 0.0
0.2
0.4
0.6
0.8
1.0
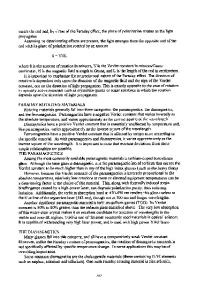
Potential vs SCE, Volts Figure 1. Cyclic voltammograms of a-WO3 and c-WO 3 thin films in 0.1l N HC1 at a sweep rate of 10 mV/sec. Transmittance spectra obtained for a-WOIITO/7059 are shown in Figure 2. At the bleached limit (+0.8 V) the stack is quite transmissive. As the spectra indicate, coloration proceeds by a progressive blueing of the W0 3 layer. A fitting scheme was adopted to permit the coloration of a-WO3 and c-W0 3 samples to be compared without the effects of film thickness differences. The transmittance spectra of the bleached sample was fitted by a technique that explicitly accounts for film thickness, real index, and absorption edge effects [8]. It was assumed that coloration occurred through changes in the extinction index (that is, by absorption). This allowed the calculation of the switched portion of the extinction index as a function of wavelength. Such a plot for the a-WO3 sample is shown in Figure 2(b). Note the broadband (but infrared biased) switching. The c-WO 3 sample was tested in exactly the manner noted above. The transmittance modulation of the c-WOfITO/7059 sample is shown in Figure 3(a). As before, the switched extinction index was calculated assuming a real index
522
. a-W0 3
+0.8 Volts
0.80)
S0.6 E C,)
C 0.42 0.2-
-0.5 Volts
0.0
300
400
500
600
700
800
Wavelength, nm 1.5a-W0 3
S1.0
-0.5 Volts
0)
0.5 o)
0.0,
300
400
500
600
700
800
Wavelength, nm Figure 2. The (a) transmittance and (b) extinction index of an a-WOJITO/7059 sample in 0.1 N HC1 at 0.8, -0.08, -0.16, -0.24, -0.32, -0.4, and -0.5 V vs SCE. dispersion curve that remained fixed during switching. There are readily discernible differences between the a-W0 3 and c-W0 3 switching. While switching occurs as a progressive blueing in both samples, c-WO3 switching is "bluer" (less broadband) than that of a-WO3 . In comparing the switched k curves in Figures 2(b) and 3(b), aWO 3 exhibits more modulation at wavelengths below 570 to 700 nm (depending on potential) while c-W0 3 is a better modulator in the very near infrared, especially at higher colorations (lower potentials).
523
1.0 -'
c-W0
3
'
+0.8 Volts
'
0.8a) C
S 0.6 E
CO)
c- 0.4
,
I-
0.2
Data Loading...