Defects and Interfaces in GaN Epitaxy
- PDF / 6,792,703 Bytes
- 7 Pages / 576 x 777.6 pts Page_size
- 102 Downloads / 374 Views
different from other known semiconductors. In particular, epilayers with high optoelectronic performance are characterized by high dislocation densities, several orders of magnitude above those found in other optoelectronic semiconductor films.3 The lattice mismatch between sapphire and GaN is —14%, and the thermal-expansion difference is close to 80%. In spite of these large differences, little thermal strain is measurable at room temperature in epilayers grown at temperatures above 1000°C. Epitaxy on other
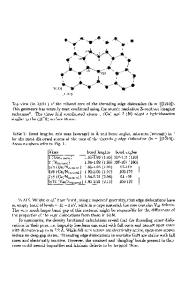
Top Surface Double HeteroStructure
Substrate/Film Interface
Figure 1. Cross-sectional transmission-electron-microscopy (TEM) view of a highefficiency Nichia blue light-emitting diode. The dislocation density of 10wcm~2 is remarkable for such an efficient and durable device. MRS BULLETIN/FEBRUARY 1997
systems, like SiC, with much better similarity in lattice parameter and thermalexpansion characteristics, has failed to produce better performance than films grown on sapphire. The origin of these puzzling properties of nitrides on sapphire rests in its microstructure. This article presents a survey of the microstructure associated with epitaxy of nitrides by MOCVD.
Microstructure of HighPerformance Light-Emitting Diodes Figure 1 is a cross-sectional transmission-electron-microscopy (TEM) microgaph of a high-performance Nichia blue light-emitting diode (LED).3 The LED was grown on (0001) sapphire by MOCVD.4 The device layers consist of ~4 /xm of Si-doped rc-type GaN, followed by a GaN:Si/InGaN(Si + Zn)/AlGaN:Mg double heterostructure and a p-type GaN:Mg cap layer. The InGaN active layer was heavily doped with Zn to provide recombination centers that emit at —450 nm. The active areas of the LEDs were ~3 X 10 4 cm2. The device performance was characterized prior to the microscopy to have a maximum external quantum efficiency of 4% at 0.8 mA. The total output power increases steadily with drive current to about 3.3 mW at 100 mA. The image in Figure 1 was taken under two-beam bright-field conditions, which highlights the dislocation distribution in the material. Dislocations are seen as dark lines propagating in a direction normal to the substrate, crossing the active region of the device. They appear in clusters with a separation of about 0.3 /nm, yielding a dislocation density of ~~1010 cm" 2 . A view from the top is shown in Figure 2. The dislocations in this planar-view TEM image are seen in a cellular arrangement corresponding to a columnar structure of crystallites with a very small angular distribution in orientation. There are two components to this distribution: One is tilt of the c-axis with respect to the growth direction (full width at half maximum of ~6 arc min), and the other is twist of the column's orientation about the c-axis. As shown in Figure 3, these films consist of columns with very small angles of rotation in between, their boundaries requiring dislocations with separations of the order of 100 nm. Transmission-electronmicroscopy observations of such high densities of dislocations in highly
Data Loading...