Effects of Sc or Tb Addition on the Microstructures and Resistivities of Al Thin Films
- PDF / 3,489,700 Bytes
- 6 Pages / 414.72 x 648 pts Page_size
- 29 Downloads / 345 Views
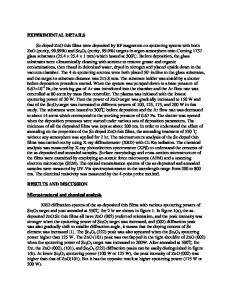
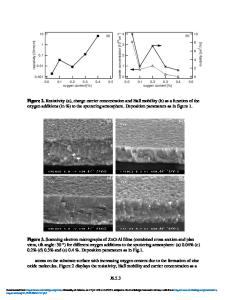
perature, the noticeable diffraction peaks associated with Al alloy metallic compounds All-xTbx are barely observable, as the figures show. TEM observation revealed that a. 0 C14 these as-made Al- rareX"= earth alloy films 7.3 at% \--1L(containing about 3 to 4 3.1 at% • 2.6 at% at% of added elements) ' 1.5 at% have very fine grains SPure Al about 100 nm in diameter 60 40 20 (see Figs. 2(a) and 2(b)). 20(') Note that the feature of Fig. I X-ray diffraction profiles of AI-Tb alloy thin films the observed grains of as a function of the content of added Tb elements both the as-made alloy films is relatively clear, unlike other Al-rare-earth alloy thin films (Al-RE, RE = Y,La,Pr,Nd,Sm,Gd and Dy)(3-6). Selective area diffraction analysis of the samples in Fig. 2 indicates that their structures consist mainly of highly supersaturated solid solutions of the Al phase. The corresponding energy dispersive X-ray analysis (EDX) of the Al-Tb samples in Fig. 2 revealed that the added Tb element was homogeneously distributed in the Al matrix, though this is not presented here. All of the as-made Al-rare-earth alloy film samples in Fig. 1 were Fig. 2 Bright field images of as-deposited (a) isochronally annealed in a vacuum (less AI97Sc 3 and (b) AI9.sTb 3. 1 alloy thin films. than 10-4 Pa.) at various temperatures Al for 30 min. The changes in their Isodironal Annealing for 3min resistivities are shown as functions of = 1.5 aI both the annealing temperature and the -, 20 = 3.0 aS composition of each added element in = 1.5 a% Fig. 3. The results for pure Al films are ý:t15 Ialso included for comparison. The solid 41= 3.1 a~i QL and dotted lines in the figure represent 4W 10 = = the curves obtained for the Al-Tb and AlSc alloy systems, respectively. The at% 45 values shown on the right of the figure indicate the amounts of added elements to Al. Note that the general features of U the resistivity change in AI-Sc alloy 500 300 400 0 100 200 An neal ing Tempe ratu re T () system are quite different from those of Al-Tb alloys. The resistivities of former alloy samples decrease significantly at Fig. 3 Change in resistivity p of AI-X alloy films relatively low temperature 150 °C, and ( X=Sc or Tb) as a function of the isochronal then more sharply at 200 OC. On the annealing (for 30 min) and composition. other hand, the latter Al-Tb alloys start !
108
.
!
•
I
.
I
to decrease sharply at 250 °C, and then approach the values of pure Al above 350 °C. Note here that the resistivity change of pure Al thin films on isochronal annealing is negligibly small (see the bottom part of Fig. 3). This fact most likely implies that the resistivity changes Al•.qTb3.1 due to grain growth, internal stress relief, and annihilation "4 of point or line defects are expected to be small in the
Data Loading...