Excitation Wavelength and Saturation Effects on Gallium Nitride Photoluminescence
- PDF / 255,946 Bytes
- 5 Pages / 414.72 x 648 pts Page_size
- 112 Downloads / 371 Views
83 Mat. Res. Soc. Symp. Proc. Vol. 395 0 1996 Materials Research Society
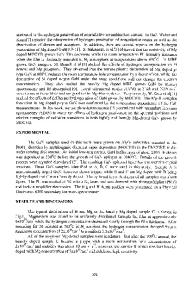
The excitation wavelength was varied from 350-450 nm. A set of neutral density filters was used to attenuate the incident laser intensity for studying the excitation power dependence of the PL. The yellow emission at 567 nm was measured as a function of incident power at each wavelength step. This data was then used to obtain the PLE spectrum for fixed photon fluxes. Results and Discussion Excitation Wavelength Dependence The PLE spectrum at room temperature for the yellow emission is shown in Figure 1. A PL spectrum is overlaid on this plot to demonstrate that absorption and emission occur at different wavelengths. 1.2 1
; L .... S"
.A
FL
-Normalized
n
Yellow PL Intensity
I
". '1 "";,
0.8 0.6
3.36 eV
0.4 0.2 0 2
2.4
2.8
Energy (eV)
3.2
3.6
Figure 1: Normalized PLE spectrum with overlaid yellow PL spectrum. Neither the peak nor the full width at half maximum of the broad yellow emission changes as the excitation wavelength is varied. The PLE spectrum indicates the existence of a narrow band of shallow donors. The plot also shows some as yet unidentified fine structure. The donor absorption mechanism can be represented by D+--->D 0 +h, from which it is concluded that the yellow transition begins with a process involving the neutral donor. The model shown in Figure 2 is used to describe the observed transition. It is evident that the radiative yellow transition is only accessible through the shallow donor states since no direct absorption of the5 yellow is observed. The complimentary infrared transition that has been previously reported has not been observed in these experiments, and therefore some form of nonradiative relaxation is assumed to occur before yellow emission. Eg Donor State
2.19 eV
Yellow Ground State
V
Figure 2: Excitation model of yellow emission.
584
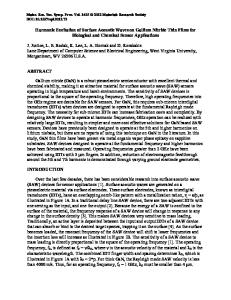
Power Dependence The PL intensity was measured as a function of incident power at each wavelength step. Figure 3 illustrates the behavior of the bandedge and the yellow for above gap pumping as the pump power is varied. It is observed that the yellow PL intensity is proportional to Fk where F is the intensity of the pump. The measured value of k is plotted as a function of excitation energy in Figure 4. W
U.9
---- Band Edge
.0 .
,
0.8
Yellow
-
.9
•;•
•a,0.7
0.6
S106 S0.5
0.4 10
10-3
101 10-1 Excitation Power (mW)
0.3ý
103
2.6
2.8
3
3.2
3.4
3.6
Excitation Energy (eV)
Figure 4: Yellow PL power dependence Figure 3. Typical PL power dependences as a function of excitation energy. for above gap pumping. Above gap pumping yields a nearly square root dependence (k--0.4) while below gap pumping yields a nearly linear (k=0.8-0.9) dependence on input power. We note that the data does not fit well to an Fk dependence in the wavelength region where k changes rapidly. The data outside this region can easily be explained by a three level model in which the conduction band and shallow donor band are treated as one level. Figure 5 shows this model wi
Data Loading...