GaN Three Dimensional Nanostructures
- PDF / 1,426,872 Bytes
- 6 Pages / 414.72 x 648 pts Page_size
- 70 Downloads / 360 Views
Mat. Res. Soc. Symp. Proc. Vol. 395 © 1996 Materials Research Society
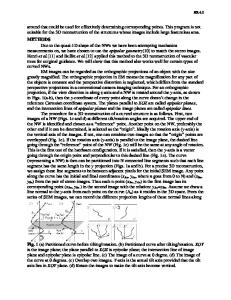
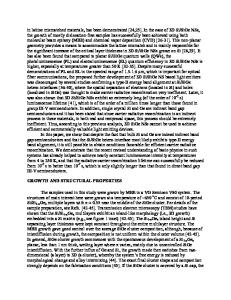
EXPERIMENT GaN was grown by MOCVD. 6H-SiC (0001) wafers manufactured by Cree Research, Inc. were used as substrates. The growth was done in such a manner that the GaN formed was not a continuous layer but consisted of separated dots. The dot size was measured by SEM and TEM. Optical properties of the dots were studied at various temperatures and excitation levels. The PL measurements were performed using above band gap radiation provided by a 250 W Hg-lamp (weak excitation) or a 10 kW N2-laser (strong pulsed excitation). A liquid-helium cryostat was used for PL experiments at 4.2 K. The CL was excited with a 0.05 mA electron beam at an accelerating voltage which was varied from 4 to 15 kV. CL was investigated at 80 K. The PL and CL spectra were measured employing a 0.6 m LOMO MDR-23 monochromator with a photomultiplier detector and corrected for instrumental response. It was found that depending on growth conditions the dot lateral size in different samples ranged from -20 rn to more than 2 jpm (Fig. 1). The average dot density was controlled in the range from 107 to 109 cm- 2. The HEED and TEM measurements showed that the dots had a single crystal structure (Fig. 2).
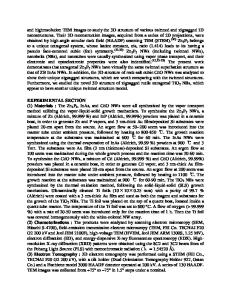
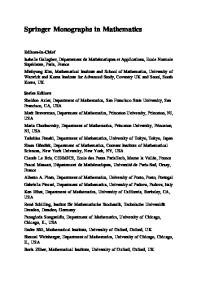
Figure 1. SEM image of the surface of SiC substrate and GaN dots. Luminescence measurements were performed on a sample with dot sizes ranging from 50 to 250 nm (Fig. 3). The size distribution was measured by TEM. The PL and CL spectra of GaN dots exhibited a blue shift and a broadening of the edge peak as compared with its position and width for continuous GaN layers grown on SiC. The PL spectra for a GaN continuous layer and GaN quantum dots at 4.2 K at high and low excitation levels are shown in Fig. 4. 296
Figure 2. HEED pattern from the sample having GaN dots.
C•r
0
100
200
300
400
500
DOT SZE (nm) Figure 3. GaN dot density vs. dot size measured by TEM. 297
600
3.2
3.3 3.4 3.5 3.6 PHOTON ENERGY ( eV)
3.7
Figure 4. PL spectrum for GaN dots and a continous GaN layer grown on 6H-SiC wafer: dash line - laser excitation, solid line - hydrogen lamp excitation.
80 K
76meV
I--,
GaN -
QD GaN
7,
H7
3.2
3.3
3.4
3.5
3.6
3.7
PHOTON ENERGY ( eV) Figure 5. CL spectrum for GaN dots and a continous GaN layer grown on 6H-SiC.
298
z
0
20
100 80 60 DOT SIZE (arb.units) 40
120
Figure 6. GaN dot density vs. dot size obtained from PL data based on model [21]. Under a weak excitation, the blue shift of the GaN edge peak was -64 meV at 4.2 K (a new peak position was observed at 3.529 eV). The PL line at 3.465 eV (standard peak position for a continous GaN layer) was not detected. In the case of strong pulsed excitation, the blue PL shift was -76 meV (4.2 K). An edge peak blue shift of -70 meV and peak broadening was also observed for the CL spectra measured at 80 K (Fig. 5). We believe that the blue shift detected for the edge luminescence peak was due to three dimensional quantum carrier confinement in the GaN dots. Dots with different sizes exhibited different
Data Loading...