In-Situ Observation of Deformation Associated with R-Phase in Niti Shape Memory Alloy
- PDF / 3,475,918 Bytes
- 6 Pages / 414.72 x 648 pts Page_size
- 59 Downloads / 336 Views
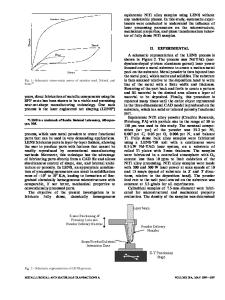
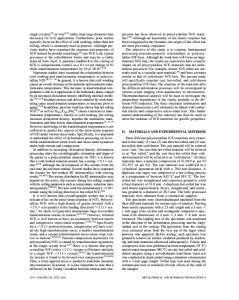
a differential scanning calorimeter (DSC) on a DuPont 2000 Thermal Analyzer equipped with a 910 differential scanning cell. The stress-strain curve was obtained through tensile testing conducted on a Model 1331 Instron machine with a strain rate of 1x 10⁻³s-. The specimen for straining in an electron microscope was 2mm in width and 5mm in length. The final thin foil for TEM examination was prepared by twin-jet electropolishing using a modified specimen holder in an electrolyte solution of 20% H2 SO4 and 80% methanol by volume at room temperature. The in-situ observation was carried out on a Philips CM200 microscope operated at 200kV and equipped with a single-tilt straining holder. RESULTS AND DISCUSSIONS Transformation Product at Room Temperature Figure 1 shows the DSC curve of the Ti 49Ni,, alloy annealed at 270'C for I00hrs after cold working. The DSC curve exhibits two transformation peaks upon cooling. It indicates that the Ti41Ni51 alloy after heat treatment undergoes the following phase transition: austenite (B2)--R-phase (rhombohedral), and then R-martensite (monoclinic B19 '). According to the DSC result, the alloy should be in the R-phase state at room temperature, which is between the Ms point and the TR point. This is confirmed by the TEM observations and diffraction pattern analyses, as indicated in Fig. 2. The typical 1/3(110)-type reflections can be clearly seen in the diffraction pattern as shown in Figs. 2(b) and (c), which are considered to be characteristic of R-phase, and which correspond to the rhombohedral structure [1]. Different R-phase variants can be observed in this alloy, as indicated by the arrow in Fig. 2(a). This is consistent with the previous investigation of the TiNiFe alloy [1]. The selected area electron diffraction (SAED) pattern in Fig. 2(b) with three sets of 1/3(110) reflections was taken from the area consisting of both matrix R, and needle-like domain R), as marked in Fig. 2(a); while the diffraction pattern in Fig. 2(c) with one set of 1/3(110) reflections is taken only from the matrix R. It is thus clear that the diffraction pattern in Fig. 2(b) is one with superimposed [001]R and [201 ]R zone axes, indexed according to the rhombohedral structure in terms of hexagonal indices [9]. Therefore, the transformation product of Ti49Nis5 alloy after annealing treatment is determined to be R-phase at room temperature, coexisting with its different variants. 44.. 65°C
0.075-42
770
0..0705-
40J/
22S.
-0. 025-
-0.12:5-
-0.225 -50
-30
-1,0
10
50 30 Temperature (*C)
70
9b
110
Fig. 1 DSC curve of Ti49Ni5' alloy after annealing treatment at 270'C for 100hrs. Mechanical Behavior The deformation behavior and shape memory effect of this alloy were examined. Unlike the
172
martensite-based TiNi alloy, the stress-strain curve of the R-phase TiNi alloy reveals two yielding stages, as shown in Fig. 3. The first stage begins at about 0.15% strain and ends at approximately 0.7% by inspecting the inserted view in Fig. 3. The second stage starts at 2% strain and finishes at appro
Data Loading...