Indicators
The debt crisis of developing countries became apparent in the early 1980s mainly in Central and South America. A look at the net flow of funds around the world — payments on interest and principal subtracted from newly introduced funds — shows that begin
- PDF / 8,330,903 Bytes
- 61 Pages / 595 x 791 pts Page_size
- 100 Downloads / 315 Views
Indicators
Japan Enviromental Council (ed.), The State of the Environment in Asia © Springer-Verlag Tokyo 2000
122
[ 1 ] Basic Economic Indicators: External Debt and
International Trade
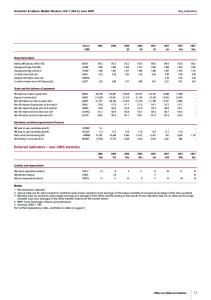
The debt crisis of developing countries became apparent in the early 1980s mainly in Central and South America. A look at the net flow of funds around the world - payments on interest and principal subtracted from newly introduced fimds - shows that beginning in the mid-1980s money tended to flow back from the developing to the developed world (Table 1). Even some Asian countries have external debt problems despite the region's rapid economic growth. Asian countries obtain a great deal of funding especially from Japan. The extent of a country's external debt is generally indicated by its debt service ratio (DSR), which is the ratio of annual debt repayments (payments on interest and principal) to the monetary amount of exports, the reason being that basically external debt must be repaid with foreign currency earned with exports. It is often said that a debt crisis emerges when the DSR exceeds 20%. In 1993 some Asian countries had very high figures, such as 24.9% for the Philippines, 28.0% for India, and 31.8% for Indonesia. One cause is the large amounts of yen credit from Japan. The rapid appreciation of the yen in the latter half of the 1980s increased direct investment from Japan in other Asian countries, but it was also a major factor that increased their debt burdens. Especially indicative of this are the high figures for the Philippines and Indonesia, which accepted especially large amounts of yen credit from Japan. China too has many long-term debts whose repayment term has not yet arrived, and these could tum into a serious problem in the future. Until now trade has been a driving force behind Asia's economic growth. Since the 1970s the NIEs of South Korea and Taiwan have been in the world spotlight for their rapid growth. They pursued export-oriented industrialization, which contrasts with the Central and South American NIEs that adopted a strategy of industrialization to substitute for imports, a strategy that later quickly lost momentum. A characteristic of Asian NIEs was how they took advantage of their cheap labor to import intermediate goods from developed countries, then process and export them. Continually increasing exports naturally led to increasing imports (Fig. 1). This strategy was in time taken over also by ASEAN countries. Beginning in the 1980s a number of Asian countries racked up double-digit annual increases in trade and achieved astonishing growth about twice the rates of developed countries (exports 5.1 %, imports 5.8%) during those same years. Another fact worth noting is that although trade until then was based on a Japan-U.S. axis, in recent years an
Table 1 Net Transfer from Developed to Developing Countries
(billions of us dollars)
1970
4.46
1980
30.23
1984
-9.41
1985
-17.64
1986
-21.0 I
1987
-29.69
1988
-31.49
1989
-25.17
1990
-21.62
Source: World Bank, World Debt Table
Data Loading...