Key Indicators
- PDF / 127,016 Bytes
- 2 Pages / 595.276 x 841.89 pts (A4) Page_size
- 77 Downloads / 334 Views
Economic & Labour Market Review | Vol 1 | No 7 | July 2007
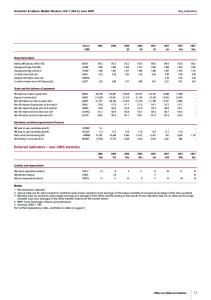
Key indic a t o r s The data in this table support the Economic review by providing some of the latest estimates of Key indicators.
Seasonally adjusted unless otherwise stated
2006 Q3
2006 Q4
2007 Q1
2007 Mar
2007 Apr
2007 May
2.8
0.7
0.8
0.7
..
..
..
Gross value added (GVA) at basic prices ABMM 1.9 2.9 CKYW –2.0 0.0 Industrial production CKYY –1.2 1.3 Manufacturing GDQB 1.5 1.0 Construction GDQS 2.9 3.6 Services CKZO –10.5 –8.9 Oil and gas extraction CKYZ –0.4 –2.6 Electricity, gas and water supply GDQN 4.4 5.2 Business services and finance Household demand
0.7 0.1 0.6 0.8 0.8 –3.1 –0.1 1.3
0.8 –0.1 0.1 1.1 1.0 –1.1 –2.0 1.0
0.7 –0.1 –0.4 0.6 1.0 0.7 1.5 1.0
.. 0.1 0.5 .. .. –2.8 –0.9 ..
.. 0.3 0.3 .. .. 1.0 –0.8 ..
.. .. .. .. .. .. .. ..
Retail sales volume growth EAPS 2.0 3.3 ABJR 1.5 1.9 Household final consumption expenditure growth (CVM) BCGT 2,444 2,340 GB new registrations of cars (thousands)1 Labour market2,3
0.8 0.3 662
1.4 1.1 446
0.5 0.5 678
0.5 .. 445
–0.1 .. 168
0.4 .. ..
Employment: 16 and over (thousands) MGRZ 28,674 28,895 MGSU 74.7 74.6 Employment rate: working age (%) DYDC 31,042 31,409 Workforce jobs (thousands) 918.6 923.7 Total actual weekly hours of work: all workers (millions) YBUS MGSC 1,426 1,657 Unemployment: 16 and over (thousands) MGSX 4.7 5.4 Unemployment rate: 16 and over (%) BCJD 861.7 944.7 Claimant count (thousands) MGSF 30,100 30,552 Economically active: 16 and over (thousands) MGSO 78.5 78.9 Economic activity rate: working age (%) YBSN 7,933 7,843 Economically inactive: working age (thousands) YBTL 21.5 21.1 Economic inactivity rate: working age (%) AP2Y 616.8 594.9 Vacancies (thousands) BEAO 126 145 Redundancies (thousands) Productivity and earnings annual growth
28,986 74.5 31,494 925.4 1,711 5.6 955.0 30,696 79.0 7,835 21.0 598.9 141
29,036 74.5 31,608 925.8 1,687 5.5 947.1 30,723 79.0 7,854 21.0 602.0 130
28,981 74.3 31,587 927.1 1,700 5.5 916.3 30,681 78.8 7,939 21.2 635.1 145
29,012 74.3 .. 925.9 1,677 5.5 905.7 30,689 78.7 7,954 21.3 635.1 129
.. .. .. .. .. .. 889.7 .. .. .. .. 637.1 ..
.. .. .. .. .. .. 880.4 .. .. .. .. 638.8 ..
GB average earnings (including bonuses)3 LNNC .. .. GB average earnings (excluding bonuses)3 JQDY .. .. A4YN .. .. Whole economy productivity (output per worker) LOUV .. .. Manufacturing productivity (output per job) LOJE .. .. Unit wage costs: whole economy LOJF .. .. Unit wage costs: manufacturing Business demand
3.9 3.5 2.4 .. 1.9 ..
4.0 3.7 2.1 .. 1.6 ..
4.4 3.6 2.7 .. 2.4 ..
4.4 3.6 .. 3.6 .. –0.1
4.0 3.6 .. 3.5 .. –0.2
.. .. .. .. .. ..
Business investment growth (CVM) NPEL 15.7 –4.2 Government demand
3.0
4.1
–0.6
..
..
..
Government final consumption expenditure growth NMRY 2.7 2.4 Prices (12–monthly percentage change – except oil prices)
0.3
0.5
0.5
..
..
..
2.4 3.5 3.2 2.3 7.9 37.748 70.675
2.7 4.0 3.5 2.6 3.4 31.637 60.633
2.9 4.5 3.7 2.6 –0.7 29.946 58.527
Data Loading...