Infrared Spectroscopy of Intersitial Oxygen in Silicon
- PDF / 322,663 Bytes
- 6 Pages / 420.48 x 639 pts Page_size
- 70 Downloads / 349 Views
INFRARED SPECTROSCOPY OF INTERSITIAL OXYGEN IN SILICON
BERNARD PAJOT* AND BERNARD CALES** * Groupe de Physique des Solides de l'E.N.S., 2 place Jussieu, 75251 Paris Cedex 05, France
** C.N.R.S.,
Universitg Paris 7,
Tour 23,
Centre de Recherche sur la Physique des Hautes Tempgratures,
45045 Orl6ans Cedex,
France
ABSTRACT A discussion of the isotope shift of the low temperature spectrum of the stretching mode of interstitial oxygen (Oi) in silicon introduces IR results showing the interaction of 0O with the silicon lattice. Evidence is given that the temperature dependence of a combination band observed at 1 liquid helium temperature (LHT) at 1205.7 cmis responsible for the room
temperature (RT)
band at 1227 cm-1 and that a weak band near 1013 cm-'
an overtone of the 518 cm-
1
is
band.
INTRODUCTION The infrared (IR) absorption of the dispersed Si 2 0 group (alias Oi) in silicon has been analyzed by Bosomworth et al. [1]. Three transitions from the same ground state are observed at LHT at 29.3, 517.8 and 1136.4 cm- 1 . The two first ones correspond to the symmetric mode vI and V2 and the last one to the anti-symmetric (or stretching) mode V3 of the non-linear 28 16 28 Si0- Si quasi-molecule. The labelling of the modes is that of a molecule XY2 with symmetry C2v. A fourth transition is observed at 1 1205.7 cmwhich is due to a combination of the stretching mode with a two-quantum excitation of the low frequency mode (v 3 + 2v 2 ). One of the merits of the work of Bosomworth et al. was to provide a self-consistent evaluation of the angle 2a of the Si-O-Si bridge for dispersed oxygen. This was obtained by adjusting the value of the potential barrier between the two equilibrium configurations of the oxygen atom about the Si Si axis in order 1 to reproduce an inversion frequency of 29 cm- . This can be done by placing the oxygen atom at 0.022 nm from the Si Si axis, which produce a - 820 if a Si-O bond length of 0.161 nm is assumed. 1 Except for the 518 cmtransition which is near the Raman frequency 1 of silicon (523 cmat 8 K), the others are relatively sharp and can be termed as lines. This sharpness can allow one to determine geometrical parameters from the isotope effect of these bands. The average percentage of naturally occurring isotopes of oxygen and silicon is : 2
160 : 99.76 Ssi : 92.17
170 : 0.04 29Si : 4.71
180 : 0.20 Si : 3.12
30
1
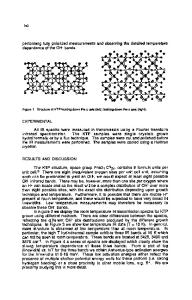
With the apparent exception of the 518 cmband, isotope effects have been observed for all the other lines using either standard or isotopically enriched samples [2,31. An expanded Oi absorption spectrum is given in figure 1. It shows the three isotopic v 3 transitions labelled 160, 170 and 180 together with other bands whose origin will be discussed later on. For a quantitative study, the V 3 mode is the most "useful" as giving rise to the most intense IR transition; moreover its shift can be expressed only as a (i) (i) function of the masses X, Y, X (i) 3 / ;3
, Y 2
[Y (1 + 2r(i) sin
and of a,
viz.
a) / y(i) (1 + 2 sin2 a)]+
Mat. Res. Soa. Symp. Proc. Vol.
Data Loading...