Non-Equilibrium Formation Of Silicon Nitride During Both Ball Milling And Ion Bombardment
- PDF / 1,744,213 Bytes
- 5 Pages / 414.72 x 648 pts Page_size
- 13 Downloads / 273 Views
439 Mat. Res. Soc. Symp. Proc. Vol. 481 ©1998 Materials Research Society
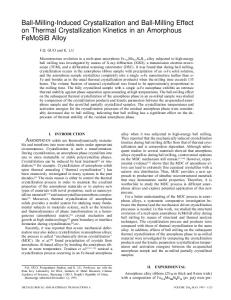
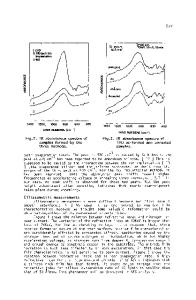
kPa pressure. The pressure of the mill was monitored with an attached pressure gauge during milling for various times up to 168 h. After milling the powder was handled in an oxygen-free glove box and, depending on the subsequent analysis, pressed into small pellets to minimise oxidation. Ion implantation of 30 keV N 2' into Si (100) wafers was carried out using the Mk4 implanter at Harwell. During nitrogen implantation to doses typically of 1018 cm 2 , the sample temperature rose to between 150'C and 500'C, depending on the dose rate used. This process generated a surface layer rich in nitrogen which was about 60nm thick. Annealing was carried out either in a tube furnace up to 1000'C or in differencial thermal analysis (DTA) equipment up to 1 1000 C at a ramp rate of 20'C/min. Annealing was carried out under flowing Ar gas in both cases. The structural evolution of the powder was monitored using a Philips X-ray diffractometer equipped with CoKa radiation (XRD), transmission electron microscopy (TEM) and DTA. Composition was measured using combustion analysis and energy-dispersive X-ray analysis (EDXA). For the ion implanted samples, Rutherford backscattering and channeling (RBS-C) was used for composition analysis and XTEM for structural analysis. RESULTS AND DISCUSSION Ball Milling. Fig. 1 shows XRD spectra following milling for 168 h and also after annealing at 1100°C in the DTA apparatus. After milling only peaks from ax-Fe and y-Fe are observed, As indicated previously[3), this suggests both Fe together with a high background. contamination from the mill and possibly an amorphous phase. After annealing, there is clear evidence for a-Si 3 N 4 formation (peaks indicated by 0) and also FeSi 2 . It is interesting to investigate when these phases form and both composition analysis and DTA are helpful here.
f annealed
0
600 1000 60 80 1 )0 200 Temperature OC Two Theta Fig. 2 DTA trace of the 168h milled powder. Fig. I XRD spectra of 168h milled powder after milling and also annealing at 1100 'C in the DTA. (o: Si 3N4 , *: FeSi 2 , ax: a-Fe, y. y-Fe). 20
40
440
Table I Composition of 168 h milled powder as a function of isochronal annealing (1 h). Annealing Temperature(OC)
N at%
H at%
Cr at%
Fe at%
Si at%
as-milled 660 770 810 900 1100
43 47 48 46 45 42
17 -
2 2 2 2 2 2
9 13 13 13 13 14
29 38 38 39 40 42
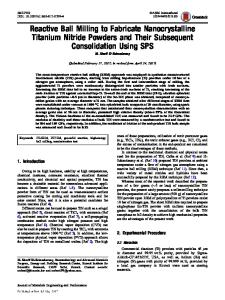
Fig. 3 TEM bright field micrograph and corresponding selected area diffraction pattern from a 168 h as-milled powder.
441
Table I shows the composition at various stages during annealing. It is clear that Fe contamination is high and, indeed, may catalyse NH 3 dissociation during milling as we have previously suggested[3]. We also notice that the N content is high throughout the annealing suggesting that the N is strongly bound (chemically) to Si following milling. H is also present after milling but is gone by 600'C: it could be that a hydride is formed as an Fig. I intermediate phase but more likely, as we shall see, th
Data Loading...