Formation of stable dopant interstitials during ion implantation of silicon
- PDF / 2,298,224 Bytes
- 17 Pages / 594 x 810 pts Page_size
- 20 Downloads / 430 Views
Present address: North Carolina State University, Raleigh, North Carolina 27650.
476
J. Mater. Res. 1 (3), May/Jun 1986
http://journals.cambridge.org
described in the next section. In Sec. Ill results are described for group V dopants, and the effect is shown to originate from interstitial defects trapped within the recrystallized layer. With group III dopants this effect was absent, but similar effects occurred due to defects trapped in the underlying damage layer as shown in Sec. IV. Finally, in Sec. V we discuss the trapping and diffusion mechanisms and show that the results can be explained by the formation of dopant interstitials during implantation, which in the case of group V dopants can survive SPE growth but subsequently decay releasing a high concentration of self-interstitials into the material.
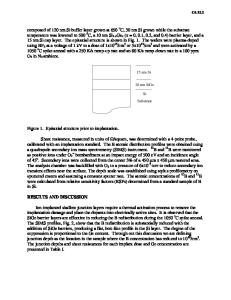
II. EXPERIMENTAL PROCEDURE A. Sample preparation Samples were prepared by ion implantation of Sb, Bi, As, B, and Ga into {100} Si at energies and doses shown in Table I. Substrates were either at room temperature (25 °C) or low temperature ( — 150 °C) and were either crystalline (c) or preamorphized (a) by a self-implantation, denoted as Si-1 in the table. Multiple implants were used for Sb and Bi implantations to obtain a uniform depth profile. Implantation was carried out under vacuum better than 10~ 7 Torr using current densities of 1-10 /j,A cm~ 2 to avoid significant heating effects. Samples were recrystallized by SPE growth in a quartz tube furnace under flowing dry nitrogen gas at temperatures not exceeding 600 °C for times typically 30 or 60 min for crystalline and preamorphized samples, respectively. Most samples were analyzed by Ruther-
0003-6951 /86/030476-17$01.75
Downloaded: 19 Mar 2015
© 1986 Materials Research Society IP address: 169.230.243.252
Pennycook, Culbertson, and Narayan: Formation of stable dopant interstitials
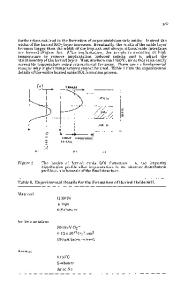
TABLE I. Details of ion implantation and analysis of samples; c and a indicate crystalline and preamorphized substrates, respectively.
Energy (keV)
Nominal dose (Xl0 1 6 cm- 2 )
Peak cone. (Xl02Ocm-3)
Sb-1
350 145 60
1.49 0.65 0.26
11.1
Sb-2
350 145 60
1.24 0.54 0.22
Sb-3
350 145 60
0.99 0.43 0.18
5.9
Sb-4
350 145 60
0.87 0.38 0.15
5.0
Sb-5
350 145 60
0.50 0.22 0.09
2.8
Sb-6
145 60
0.65 0.26
9.3
Sb-7
145 60
0.30 0.12
3.7
Sb-8
200
0.60
6.0
0.99
c
25 °C
350 180 90
0.20 0.11 0.07
1.3
0.94
c
- 150 °C
250
0.50
6.0
c
25 °C
As
100
2.00
27.0
"B"
35
1.00
10.0
Sample
Bi-1
Ion
-Bi
Bi-2 As-1 B-l
75
B-2 Ga-1
69
Si-1
30
Ga Si
0.90
25 °C
0.94
25 °C
0.97
25 °C
- 150°C
0.92
0.95
c,a c,a
25 °C - 150°C
c,a c,a
25 °C - 150°C
25 °C
c,a a
- 150°C
35
1.50
15.0
a
- 150°C
100
0.10
0.6
c,a
- 150°C
175
1.00
c
- 150°C
ford backscattering spectroscopy (RBS) and ion channeling analysis to determine the concentration and substitutional fraction of the dopant as shown in Table I, except in the case of boron samples where secondary ion mass spectroscopy (SIMS) analysis was used for concentration determinat
Data Loading...