Optimization of Blend Toughness by Simultaneous Measurement of Heat and Work of Deformation
- PDF / 628,828 Bytes
- 6 Pages / 414.72 x 648 pts Page_size
- 62 Downloads / 233 Views
273
Mat. Res. Soc. Symp. Proc. Vol. 505 01998 Materials Research Society
AP(t) =
K(t-t)-----)
d
(1)
where K(t) is a kernel function that is independent of sample and test conditions, and is approximated by a sum of decaying exponentials containing thermal capacitances and time constants. Careful calibration experiments, the details of which are provided elsewhere6 , provide these system constants. The dynamic heat profile is then obtained by deconvoluting equation (1): t
t
_( t-•)
Q(t) = afAP(4)d4+bAP(t)+cfAP(ý)e 0
d d4
(2)
0
where a,b,c and d are constants derived from the thermal capacitances and time constants. The change in internal energy upon deformation is given by the first law of thermodynamics: AU(t) = Q(t) + W(t)
(3)
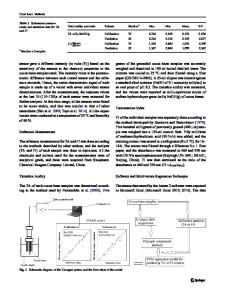
Since the work is available from the area under the force-displacement curve, an overall energy balance is easily obtained. EXPERIMENTAL Samples Methylmethacrylate based aqueous copolymer latices were provided by the DuPont company. Blend films of poly(methyl methacrylate-co-ethyl acrylate), having a Tg of 45 'C, and poly(methyl methacrylate-co-butyl acrylate), with a Tg of -5 'C, were cast from aqueous dispersions on a glass plate, dried at 70 'C for 3-4 hours and annealed at 130 'C for 20 minutes. Films were removed with the aid of water, and re-dried under vacuum at 80 0C for 10-15 hours. Samples with different amounts of hard and soft phases were prepared to study the effect of composition and test temperature on the toughness of these blends. These coatings were later hot-pressed at 130 'C to get uniformly thick films for testing, and subsequently annealed at 50 'C for a week. ASTM D638 (Type V) dog-bone shaped samples were cut out of these films, and mounted in the calorimeter for uniaxial stretching at 25 'C. A typical experiment involved stretching these samples at a strain rate of 1.12/min. to an extension close to their ultimate break point, and subsequently unloading them to zero load. Energy profiles were calculated over the entire load-unload cycle using pressure, force and displacement data. Results were normalized by the sample weight between the grips. Characterization Blend coatings were characterized for their mechanical and thermal properties by a variety of techniques including modulated differential scanning calorimetry (MDSC), tensile testing and dynamic mechanical thermal analyzer (DMTA). Figure 1 presents the thermograms obtained from MDSC experiments at a cooling rate of 2 °C/min. with a superimposed sinusoidal oscillation of amplitude ± 0.5 'C and a period of 40 s. The blends show two distinct T9's throughout the entire composition range indicating phase separation, a conclusion further supported by two peaks in tan6 obtained from DMTA measurements. Figure 2 shows the normalized Young's moduli obtained from tensile testing of the blend films in comparison with those calculated from theories of composites. At low hard phase contents, the blends behavior is that of a soft matrix with hard inclusions, which reverses to a hard matrix at high hard phase v
Data Loading...