Phase and Disorder Investigations in Boron Nitride Thin Films Grown by PECVD
- PDF / 422,253 Bytes
- 6 Pages / 414.72 x 648 pts Page_size
- 18 Downloads / 320 Views
Mat. Res. Soc. Symp. Proc. Vol. 410 0 1996 Materials Research Society
structure of the hexagonal planes. However, even though sp 2 hybridization is unambiguously detected, the presence of molecular and ionic phases due to impurities can not be excluded. EXPERIMENTAL The thin films were obtained by PECVD from a BCI3 -N2 -H2 -Ar mixture in a capacitively coupled radio-frequency (13.56 MHz) system with hot walls, at a pressure of 600 mTorr. The details of the thin film deposition procedure are specified elsewhere [9] and the deposition parameters are reported in Table I. Table I. BN thin film deposition parameters H2 r.f power BC13 Sample
(W)
A B C D
(sccm)
100 400 500 500
15 15 5 5
(sccm) 100 100 20 20
N2
(sccm) 37 37 20 20
Ar
self-bias
Pre
(sccm)
(Volt)
treat
75 75 180 180
0 0 0 -360
Ar,H 2 ,N2 Ar,H 2 ,N 2 Ar, H2 Ar, H2
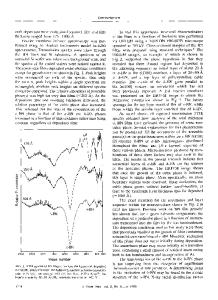
Glancing incidence angle X-ray diffraction was carried out using the experimental arrangement of Buschert et al. [20] with the asymmetric Bragg geometry. Non-monochromated copper radiation was used and a Soller slit collimator and solid state germanium X-ray detector were employed to separate the Ka doublet to achieve a low background level. The angle of incidence was 0.5 degrees. The sample thickness was estimated from Scanning Elecron Microscopy (SEM) micrographs. Electron Probe Micro Analysis (EPMA) measurements were performed to determine the boron, nitrogen, oxygen, chlorine and carbon content in the thin films. The infra-red measurements were performed with a Perkin-Elmer Model 1600 Fourier Transform Infra Red (FTIR) spectrometer. Modeling and simulations were performed by the CERIUS 2 11program on an IBM RISC 6000 work station. RESULTS AND DISCUSSION The main results of sample characterization are summarized in Table II. Fig.1-a,-b,-i, and -1 show the XRD glancing incidence patterns. Fig.1-a shows the XRD pattern of sample A which can be preliminarily indexed with the cubic BN phase through the (111) and (220) reflections detected at 206 44* and 208 80*. Fig. 1-b shows the XRD pattern of sample B in which the reflections of the cubic phase can be detected in addition to a weak reflection at 20 550, attributed to the strongest reflection of the orthorhombic phase. However, the reflections attributed to the hexagonal phase are missing in all the patterns. Fig. 1-i, and -1 show the XRD pattern of sample C, and D. These patterns can not be indexed with any single phase present in the ICSD [1] and PDF [2] databases. As for the infra-red signal from BN phases, only bands corresponding to the hexagonal phase (sp 2 hybridization) were detected (Fig.2, a-d). The halos at about 3500 cm-1 and 2500 cm-1 in sample A can be possibly attributed to N-H and B-H stretching vibrations, respectively [11]. In the same sample the 800 cm-1 band, attributed to the out-of-plane vibration of the BN hexagonal structure, is almost absent, while the band attributed to the in-plane vibrations at 1370 cm-1 is shifted to about 1400 cm- 1. The latter effect can be attributed to the presence of another band
Data Loading...