Phase diagram studies of the systems KCl-K 3 MoCl 6 and LiCl-K 3 MoCl 6
- PDF / 217,099 Bytes
- 2 Pages / 603.28 x 783.28 pts Page_size
- 71 Downloads / 294 Views
Q8 Ws to
mass of dispenser and powder measured by the load cell volumetric gas flow rate solids mass flow rate screw rotation speed REFERENCES
1. G.A. Irons: Transactions of the Iron and Steel Society, 1984, vol. 5, pp. 33-45. 2. L.R. Farias and G. A. Irons: Metall. Trans. B, 1986, vol. 17B, p. 77.
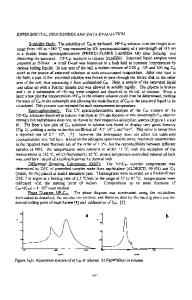
Phase Diagram Studies of the Systems KCI-KaMoCI6 and LiCI-KaMoCI6 GEORGES J. KIPOUROS and DONALD R. SADOWAY As part of an investigation of fused salt electroplating of molybdenum coatings] the phase diagrams of the two binary systems, LiCI-K3MoC16 and KCI-K3MoCI6, have been determined. These compounds are the principal constituents of the electrolyte employed in the plating studies which had as one of their goals to minimize thermal damage to the substrate through the use of a "low temperature" electrolyte. Phase diagrams were determined by cryoscopy. Each sample weighed approximately 30 g and was contained in an evacuated heart-shaped fused quartz ampoule. The ampoule had a glass well which allowed a thermocouple to be placed at the center of the salt sample. For immersion into a vertical tube resistance furnace the ampoule was surrounded by a grounded metal sheath which served to prevent induction of spurious voltages in the thermocouple by the ac field of the furnace windings. The temperature of the furnace was controlled by means of a programmable temperature controller connected in series with a thyristor. Each sample was cooled several times at different rates ranging from 0.5 K rain -~ to 2.5 K min -' to obtain data that were free from the effects of undercooling. As further precautions against undercooling the ampoules were seeded with broken quartz glass, and during the experiments the furnace was rocked in order to agitate the samples. A 22 gauge chromelP vs alumel, ASTM type K, thermocouple was used. Prior to use the thermocouple was calibrated in this laboratory against a platinum -13 pct rhodium vs platinum standard thermocouple. For optimal response to temperature fluctuations, the bottom inch of the thermocouple wire was not insulated. Partially compensated by a dc offset device, the thermocouple output was recorded continuously on a one millivolt full-scale strip chart recorder. Periodically, the temperature was measured by a potentiometer. Phase changes were obGEORGES J. KIPOUROS is Research Scientist, General Motors Research Laboratories, Electrochemistry Department, Warren, MI 48090. DONALD R. SADOWAY is Associate Professor of Materials Engineering, Massachusetts Institute of Technology, 77 Massachusetts Avenue, 8-109, Cambridge, MA 02139. Manuscript submitted July 22, 1985. METALLURGICALTRANSACTIONS B
served in the measured temperature vs time curves. On the basis of the determination of the melting point of potassium chloride the total absolute error in estimating the liquidus temperature with this apparatus is about 2 K. Potassium hexachloromolybdate, K3MoCI6, was supplied by Climax Molybdenum Company as 99.74 wt pct pure, the remainder being excess potassium chloride. Prior to use K3MoCI6 was t
Data Loading...