Photo- and Electro-Luminescence from Deuterium Terminated Porous Silicon
- PDF / 362,263 Bytes
- 6 Pages / 414.72 x 648 pts Page_size
- 53 Downloads / 435 Views
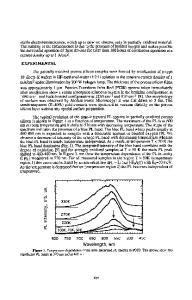
gm-thickness) was formed onto the n-type PS layer. Degradation of the PS layers by light soaking was performed using a Xe lamp with the intensity of 100 mW/cm 2 . RESULTS AND DISCUSSION OPTICAL PROPERTIES The microstructures of these porous Si films were studied using Raman spectroscopy and Fourier transform infrared (FTIR) measurements. Figures 1 (a), (b), and (c) show the Raman spectrum of H-PS and D-PS, respectively. We had earlier reported the Raman spectrum of D-PS and compared its nanostrucure to that of H-PS [2]. However, a quantitative discussion about the size estimation was not made because the wagging mode of Si-D 2 overlapped the 520.5 cm-1 LO Raman band. Therefore, in this Raman study, we intend to extract the Si-LO Raman band from
the D-PS Raman spectrum by subtracting the wagging mode. Figure 1 (a) shows both the LO Raman band and the SiH 2 wagging mode of H-PS. The positions of these spectra are separated as 515 cm-1 for the LO phonon peak and 625 cm-I for the SiH 2 wagging mode peak. However, due to the deuterium termination, the frequency of Si-D 2 wagging mode shifts to around 530 cm- 1, which overlaps the LO Raman band. By shifting and subtracting the spectrum of the SiH 2 wagging mode, it is possible to obtain the pure Si-LO Raman band from the D-PS spectrum. Figure 1 (b) shows the measured Raman spectrum of D-PS (solid line), overlapped Si-D 2 wagging mode (dotted line), and the extracted Si-LO Raman band (dashed line). The extracted SiLO Raman spectrum of D-PS (broken line) has almost the same shape as that of H-PS (dotted line) as shown in Fig. I (c). The size of the nanostructure can be estimated using a spatial correlation model [5], and both the LO Raman spectra can be fitted with an average diameter of 3.5 nm as shown by the solid line in Fig. 1 (c). Our TEM observations also showed that both PS have almost the same size for the nanostructure. The TEM observations agree well with the above Raman estimation, thus we can conclude that the dissolution reaction of DF electrolyte is almost the same as that of HF. The surface chemistries of H-PS and D-PS were characterized from the stretching- and the scissor-mode absorption peaks [3]. In the H-PS samples, absorbance due to the stretching mode of Si-H species at around 2100 cm-1 and the scissor modes of Si-H 2 at around 910 cm-1 can be observed. In the D-PS samples, the stretching modes shift to around 1530 cm- 1 and the scissor modes of Si-D 2 to 657 cm-1 due to deuterium termination. As no Si hydride-peak is observed in D-PS, the surface of Si nanocrystals can be regarded as completely deuterated by the DF-ethanolD6 electrolyte. The inset of Fig. 2 shows the optical absorption and the photoluminescence (PL) spectra of H-PS and D-PS samples at room temperature. The PL spectra of these porous samples were measured in vacuum using 325-nm excitation light from a He-Cd laser. The calibration of the spectral sensitivity was performed using a standard lamp. Despite the absorption spectra of both PS samples being the same, the peak wavelength of t
Data Loading...