Photoresist Stripping using Ozone/Deionized Water Chemistry
- PDF / 1,037,499 Bytes
- 6 Pages / 414.72 x 648 pts Page_size
- 37 Downloads / 492 Views
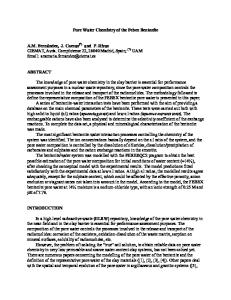
sulfuric/peroxide process, this method provides for very low cost of ownership and more environmentally sound wafer processing. EXPERIMENT In the experimental setup, the liquid flows from the process vessel to the pump through a heat exchanger to the filter through an ozonator and then back to the vessel. The ozone is generated from the ozone generator and fed to the ozonator where the ozone gas is mixed with de-ionized water. The gaseous ozone is also simultaneously fed to the bottom of the process vessel via a specially designed device that provides a uniform stream of gaseous ozone into the bath. Gaseous and dissolved ozone were monitored using inline ozone analyzers. A schematic diagram of the experimental setup is shown in figure 1.
lcm
-N
L2t z.J I0
25
.M..O.2 ..
Figure 1. Experimental Setup.
Figure 2: Dissolved 03 as a Function of Gaseous 03 at Various Temperatures
Wafers were processed in a fully automated wet station in the Applications lab at SubMicron Systems Corp. Wafers coated with positive hard-baked resist were used for this study. Resist types used were: AZ1518 (A), HIPR6512 (B), and Shipley SPR2 (C). Wafers also underwent different ashing and implantation processes prior to the D103 step. The process sequence was: (DIW-0 3) followed by down flow spin drying using standard PFA high profile cassettes. Surface inspection for complete resist removal was done visually using an optical microscope. Further evaluation was done using SEM. RESULTS The experimental setup was designed to fully characterize the removal of photoresist from bare silicon and patterned wafers using the ozone/water chemistry. Only results of stripping un-ashed and ashed wafers will be presented in this study. Variables studied in this study were: ozone (gaseous and aqueous) concentration, flow dynamics, and bath temperature. Figure 2 shows the dissolved ozone concentration versus the input gas concentration at different temperatures. As shown in figure 2, the concentration of dissolved ozone increases with the increase in the concentration of the gaseous ozone. The bath temperature effect on the ozone solubility in deionized water can be also seen from either figure 2 or 3. As shown in either figure, the lower the temperature the higher the concentration of the dissolved ozone. More than 90 ppm of dissolved ozone can be achieved in de-ionized water at 5 °C and 200 ppm of gaseous ozone. 174
Figure 4 shows the build up curves of ozone at various temperatures. A higher rate of ozone build up can be seen in the first 20 minutes after which the concentration approaches approximately saturation at that temperature. Approximately, 25 ppm of dissolved ozone can be achieved after 25 min. of continuous ozone injection into the bath while a concentration of 35 ppm can be achieved at 15 TC at the same time. When the temperature was decreased to 5 TC, the ozone level achieved was about 90 ppm after 30 min. of ozone injection into the process bath.
APPI Lob D.U
TCC.CIIC.C
I ON TmTeau0.i5C BH
.60
Figure 3: Dissolved 03 as a Function
Data Loading...