Polymer Hosts for Non-Linear Absorbing Materials
- PDF / 293,066 Bytes
- 6 Pages / 414.72 x 648 pts Page_size
- 48 Downloads / 327 Views
381
Mat. Res. Soc. Symp. Proc. Vol. 374 * 1995 Materials Research Society
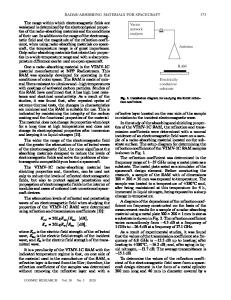
Figure 1: Optical limiting measurement set-up.
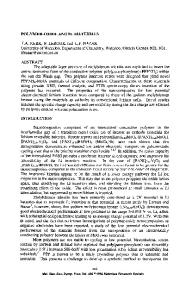
The samples were between 1-2mm thick, and therefore were "thin" in the context of the experiment, ie the beam size did not vary along the sample length. For the work reported here, each point on the graphs represents the average of 10 shots (fired at about 1Hz to eliminate the possibility of cumulative thermal effects). We plot optical density (OD) against input energy density, since OD is constant for stable (equilibrium) states (see eg Harter et al [4]), and allows us to display changes of more than one order of magnitude in transmission. Pulse shaping The temporal profiles of the transmitted pulses were recorded using a LeCroy fast waveform digitizing recorder. The incident pulse temporal profile was a 14ns near-Gaussian. The conventional measure of pulsewidth is the full width at half-maximum (FWHM). However, we have defined an alternative measure tP which, unlike FWHM, uses all of the information in the profile. For this, tcpis defined as the minimum time interval which contains 71% of the pulse energy. This measure is not prone to the extreme fluctuations which are seen in FWHM for non-linear absorbers, which tend to distort the pulseshape. tcpis equal to FWHM for Gaussian profiles. The principal reason for looking at pulseshaping is because of the complex behaviour of HITCI. Figure 2 shows the non-linear absorption of HITCI over a broad range of input energy. The rise and fall of the OD has been explained by Hughes et al [5] in terms of a singlet manifold absorption mechanism. A characteristic of HITCI is pulse shaping - the transmitted pulselength increases then decreases with increasing incident energy. Optical density 1.4
1.2
-
1
-
0.8
-
W
-
% 68066
Figure 2:
in HITCM
0.6
0.4 0.2 0
1
Complex limiting behaviour
2
3
4
5
6
Log energy density (mJ/sqcm)
382
Laser-induced damage We also carried out some assessment of laser-induced damage thresholds (LIDTs) for the samples. This was done using the same set-up as for the other measurements. Damage is readily identified as a shot to shot reduction in the transmitted signal. Other optical measurements We compared the transmission (and some fluorescence emission) spectra of the polymer samples and their equivalent solutions. RESULTS Polyurethane samples Polyurethane is commonly used as a benign environment for linear absorbers and photochromic materials. A variety of formulations are available. The type we used was a two-part mix. The dye was dissolved in the polyol component at 90 0 C. An isocyanate component was then added, and the mixture degassed under vacuum. The samples were cured between glass plates for 10 hours at 800 C followed by a post-cure for 2 hours at 140'C. For these samples, because of the softness of the polyurethane product, we did not remove the glass coverplates. CAP, HITCI and TPP were successfully incorporated to give clear products of homogeneous appearance; CuPc did not dissolve in the polyol.
Data Loading...