Polysilicon Films Formed On Alumina By Aluminium Induced Crystallization Of Amorphous Silicon
- PDF / 290,461 Bytes
- 6 Pages / 612 x 792 pts (letter) Page_size
- 107 Downloads / 277 Views
0910-A21-01
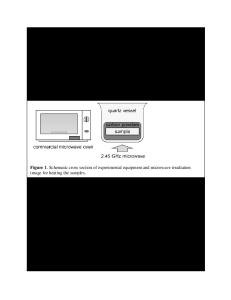
Polysilicon Films Formed On Alumina By Aluminium Induced Crystallization Of Amorphous Silicon Etienne PIHAN1, Abdelilah SLAOUI1, and Claude MAURICE2 1 InESS, CNRS-ULP, 23 rue du loess, Strasbourg, 67037, France 2 SMS Centre, Ecole des Mines, 158, cours Fauriel, Saint Etienne, N/A42023, France
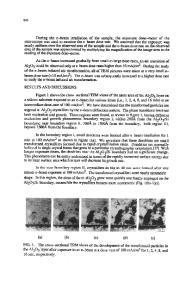
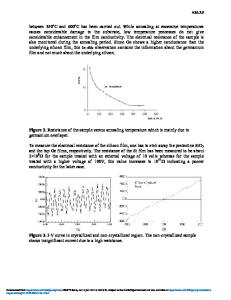
ABSTRACT We investigated the structural quality of polysilicon films fabricated by the aluminum induced crystallization (AIC) of amorphous silicon on alumina substrates. We analyzed the overall crystallographic quality of the poly-Si films in terms of grain size distribution and grain orientation versus crystallization temperature. For these studies, we used extensively the orientation imaging micrograph (OIM) technique, a very powerful tool that allows elucidating the inner-grain structure, the grain boundaries and the grain orientation. From our analysis, we may conclude that the polysilicon films formed by AIC on alumina substrates have the following features: (i) for all investigated temperatures, most of the silicon grains have a deviation angle from (100) crystallographic orientation between 5 and 25°; (ii) increasing the annealing temperature tends to decrease the (100) preferred orientation; (iii) the angular boundary distribution revealed that the main defects are those that have been observed inside isolated dendrites, namely low angle boundaries ( 15 µm) it is expected that the electrical properties of the resulting poly-Si layer will be driven by the low quality (small grains) regions. The grain size can also be deduced from OIM images using criteria 2 (all disorientation superior to 2° is a grain boundary). Figure 5 plots the average grain diameter versus annealing temperature as deduced from the EBSD measurements with the two different criteria on grain boundary definition. The grain size as deduced from optical microscopy images are plotted as well for comparison. When excluding the twins (criteria 1), we observe that the grain size decreases from about 23 µm diameter at 400°C down to 7 µm at 550°C. The trend is similar to the values deduced from optical image analysis but the values are systematically lower. This similarity was of course expected since the twins Σ3 and Σ9 are found as the main boundary types present inside the isolated dendrites. The fact that the values are systematically lower from EBSD with criteria 1 than by optical may be attributed to the twins of third order that are also present in some isolated dendrites as well as the errors in measurements. On the contrary, the deduced average grain size with criteria 2 is almost temperature independent and it is in the range of 3 to 6 µm. In this particular case, the grain size distribution follows a log normal type where most of the grains are exhibiting a size less than 5 µm. 25
0,0 5
10
15
20
25
30
35
40
45
Frequency
0,1
50
55
60
65
70
425°C
0,0 5
10
15
20
25
30
35
40
45
0,1
50
55
60
65
70
450°C
0,0 5
10
15
20
25
30
35
40
45
0,1
50
55
60
65
70
500°C
0,0 5
10
15
20
25
30
35
40
Data Loading...