Correction to: Alternative graphical displays for the monitoring of epidemic outbreaks, with application to COVID-19 mor
- PDF / 537,933 Bytes
- 2 Pages / 595.276 x 790.866 pts Page_size
- 53 Downloads / 235 Views
(2020) 20:265
CORRECTION
Open Access
Correction to: Alternative graphical displays for the monitoring of epidemic outbreaks, with application to COVID-19 mortality Thomas Perneger1*, Antoine Kevorkian2, Thierry Grenet3, Hubert Gallée4 and Angèle Gayet-Ageron1 Correction to: BMC Med Res Methodol 20, 248 (2020) https://doi.org/10.1186/s12874-020-01122-8 Following the publication of the original article [1], it was noted that due to a typesetting error the Fig. 4 and Fig. 5 have been switched, the figure captions are correct. The correct figures and captions have been included in this correction, and the original article has been corrected. Author details 1 Division of clinical epidemiology, Geneva University Hospitals, and Faculty of medicine, University of Geneva, Geneva, Switzerland. 2Teem Photonics, 61 Chemin du Vieux Chêne, 38240 Meylan, France. 3Neel Institute, Université Grenoble Alpes, Grenoble, France. 4Institute of Environmental Geosciences, Université Grenoble Alpes, Grenoble, France.
Reference 1. Perneger, et al. Alternative graphical displays for the monitoring of epidemic outbreaks, with application to COVID-19 mortality. BMC Med Res Methodol. 2020;20:248.
The original article can be found online at https://doi.org/10.1186/s12874020-01122-8. * Correspondence: [email protected] 1 Division of clinical epidemiology, Geneva University Hospitals, and Faculty of medicine, University of Geneva, Geneva, Switzerland Full list of author information is available at the end of the article © The Author(s). 2020 Open Access This article is licensed under a Creative Commons Attribution 4.0 International License, which permits use, sharing, adaptation, distribution and reproduction in any medium or format, as long as you give appropriate credit to the original author(s) and the source, provide a link to the Creative Commons licence, and indicate if changes were made. The images or other third party material in this article are included in the article's Creative Commons licence, unless indicated otherwise in a credit line to the material. If material is not included in the article's Creative Commons licence and your intended use is not permitted by statutory regulation or exceeds the permitted use, you will need to obtain permission directly from the copyright holder. To view a copy of this licence, visit http://creativecommons.org/licenses/by/4.0/. The Creative Commons Public Domain Dedication waiver (http://creativecommons.org/publicdomain/zero/1.0/) applies to the data made available in this article, unless otherwise stated in a credit line to the data.
Perneger et al. BMC Medical Research Methodology
(2020) 20:265
Page 2 of 2
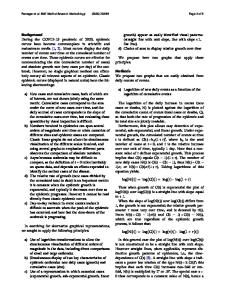
Fig. 4 Logarithm of relative growth rate of deaths attributed to COVID-19 over time in 11 European countries, as of June 5, 2020 (from top right down): Russia (navy blue), Italy (light pink), Sweden (dark pink), Portugal (light green), United Kingdom (teal), France (mustard), Spain (orange), Germany (dark green), Netherlands (purple), Belgium (light blue), Switzerland (red). Smo
Data Loading...