Effect of excess Au on antiphase domain growth in Cu 3 Au
- PDF / 467,386 Bytes
- 5 Pages / 612 x 792 pts (letter) Page_size
- 51 Downloads / 303 Views
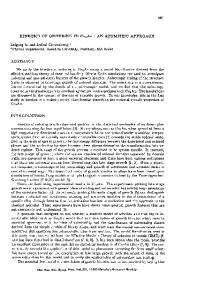
microscopy, followed closely the procedures used in the earlier work on the stoichiometric alloy. ~'z Briefly, the alloys as illustrated in the partial phase diagram in Fig. i were disordered by quenching from 450~ into water and then aged at various temperatures within the Cu3Au I ordered phase region. The APD structures produced by various aging treatments were studied with a Hitachi HU-IIA electron microscope operating at I00 kV. Average APD sizes were determined from 110 dark field images obtained from grains having (Ii0} foil norreals. As in the previous work, 2 the APD sizes were measured by lineal analysis with a circular test line /~25 I
I
I
I
O{ ( D I S O R D E R E D ) 400
o
o
375
ttl nD 350 b-*E nlaJ 02r 325
/
ttl I--..
EXPERIMENTAL
PROCEDURE
T h r e e n o n s t o i c h i o m e t r i c Cu3Au a l l o y s w e r e o b rained from E n g e l h a r d I n d u s t r i e s in the f o r m of a s r o l l e d s t r i p ~0.25 cm • 2.5 c m . C h e m i c a l a n a l y s e s r e c e i v e d with the a l l o y s showed them to contain 25.98, 27.94, and 31.46 at. pct Au. S p e c i m e n p r e p a r a t i o n and heat t r e a t m e n t , as well as the p r e p a r a t i o n of thin foils for e x a m i n a t i o n by t r a n s m i s s i o n e l e c t r o n
300
275
250 15 C. L, RASE is with Central Foundry Division, General Motors Cor-
poration, Saginaw,MI 48603. D. E, MIKKOLAis Professor of Metallurgical Engineering,MichiganTechnological University, Houghton, MI 49331. Manuscript submitted May 24, 1974. METALLURGICALTRANSACTIONSA
~ ud
I
20
I
I
I
25
30
35
40
ATOMIC PERCENTAu Fig. 1--Schematic of a portion of the phase diagram of Cu-Au system showing alloy compositions studied in the current investigation. VOLUME 6A, DECEMBER 1975-2267
1 0 0 0 0
r
i
i
,~,,ll
i
i
~
li,~i~
i
I
I
i1,11E
I
11111'4
P
P Ill
'
Table I. Average Antiphase Domain Sizes for Initially Quenched CuaAu (Ref. 2) and CuaAu + Au Alloys given Various Annealing Treatments
375~
T i me, h
Number o f Intercepts
0.5 3 10 20 45 50 100 20O
218 208 171 195 117 92 58
looo
350~
/~ A
Number of Intercepts
133 310 624 892 1333 1800 270O
298 244 236 -
37
D, A ~75 175 470 738 -
Cu-25.98 At. Pct Au 375~
cu-~s.ga."Ao}"~ A oV ;c~_ ~ .~ ~
"!,~
Cu-25 At. Pct Au
100
I
3
10 20 50 100 200
157 640 537 681 353 496 464
~ /lllll
I
I
I pl~l/~
1
I
I
I Illlll
I
10
1QQ
1000
HOURS Fig. 2--Average antiphase domain size vs time for initially disordered Cu-25.98 pct Au annealed at 375 and 320~ Error bars indicate the range of sizes from different micrographs, while the point is the average of the sizes. f,
320~ 10000
1
I
0.1
o
182 368 714 1057 1458 2180 3343
-
i
r
, ,,,b,,
~
i
, ,,,11,
I
I
~ iEipllf
756 1189 709
I
,
~ ~,,i
I
I I [11
//
-
365 511 718
CU- 2 / Z ~ / ' ~ - 4 " 4 " -
Cu-27.94 At. Pct Au 320 ~
370~
2
3 10 20 50 100 200 400 613 813 1000
434 385 679 490 887 599 433 257 314 276
346 623 894 1421 2099 2959 3707 4475 4361 4551
100
-
I
I
IIIIIII
I
I
I IIIIIL
[
I
I ILII
Data Loading...