Effects of Light Soaking Conditions on Thin Film Silicon:Hydrogen Alloy Solar Cells
- PDF / 219,560 Bytes
- 6 Pages / 420.48 x 639 pts Page_size
- 65 Downloads / 319 Views
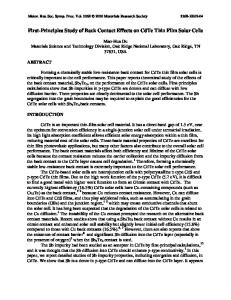
EFFECTS OF LIGHT SOAKING CONDITIONS ON THIN FILM SILICON:HYDROGEN ALLOY SOLAR CELLS D.R. WILLETT, D.P. TANNER AND G. MCHENRY ARCO Solar, Inc., P.O. Box 2105, Chatsworth, CA 91313 ABSTRACT Variation of environmental conditions during light soaking of thin film silicon:hydrogen alloy (TFS) solar cells can have measurable effect on durability. Such sensitivity must be considered in optimizing processes for maximizing long-term performance. This paper will describe the effects of operating temperature, light intensity, operating bias, and duration of light soaking on the stability of TFS p-i-n solar cells. INTRODUCTION The stability of thin film sillcon:hydrogen alloy (TFS) solar cells has been modeled by others [1]. Figure I shows data that Indicate better long-term device performance can be realized when actual use conditions are employed. A wide range of environmental parameters must be characterized to meaningfully evaluate TFS devices in the laboratory. EXPERIMENTAL
E1THOD
All devices used In this study were TFS p-l-n superstrate solar cells deposited by glow discharge on tin oxide coated glass. The cells studied were 4.3 cm2 , and monolithic modules evaluated were both 225 and 900 cm2 in area. Light exposures were performed In sunlight,
In Atlas Instruments C135 or 0165
Weatherometers, and under a Spectrolab XT-10 xenon lamp. Forward bias studies In the dark were conducted with Hewlett-Packard constant current power supplies. Light I-V measurements were made with a xenon lamp sunlight simulator designed to match a global spectrum. The light intensity was set to 100 mW/cm2 using a pseudo TFS monitor cell (a Hamamatsu single crystal silIcon 11
0.98 0.96 0.94 -6
0.92 u_ W
0-9 0.88
0• Z
a0
0.86 0.84 0.82 0.8 0.780.76 0.74
0
0.2
0.4
0.6 ON RO Thousond R
"S
0.8
1
1.2
Fig. 1. Average efficiency ratio vs time of a group of cells exposed In sunlight at Chatsworth, Ca. Stabilized efficiency approximately 7%.
Mat. Res. Soc. Symp. Proc. Vol. 70. 1•986Materials Research Society
600
The cell with a green filter) calibrated to SERI 1983 AM1.5 global spectrum. cell temperature was kept at 250C ±10 except where the light soaking was actually done In the tester at different temperatures. Software and hardware to measure I-V curves, tabulate the parameters of each cell, and store the Large area modules were tested with a results are detailed elsewhere [2]. Spectrolab XT-25 pulse xenon solar simulator. RESULTS Control: Because many of the tests were done with different temperatures and light Intensities, a check of the possible changes of device temperature and illumination coefficients had to be made. Thirty-two TFS cells were measured at temperatures ranging from 200C to 700C with Illumination levels ranging from 1/100 to 1 sun before and after lioht soakina. After 728 hours of lioht soaking at 500C, the before and after data Indicated changes of less than 1%. This Is well within the reproducibility of light I-V measurement and further corrections were not made. (Note that from the spectral response data of
Data Loading...