Optically Detected Magnetic Resonance of Sulfur Doped Gallium Phosphide
- PDF / 239,600 Bytes
- 5 Pages / 420.48 x 639 pts Page_size
- 29 Downloads / 352 Views
OPTICALLY DETECTED MAGNETIC RESONANCE OF SULFUR DOPED GALLIUM PHOSPHIDE
K. L. BROWER Sandia National Laboratories,
Albuquerque,
NM 87185-5800
ABSTRACT having a An isotropic optically detected magnetic resonance (ODMR) Lorentzian lineshape at g - 2.050 ± 0.003 and linewidth (FWHM) of 67.3 mT is 3 The ODMR at g - 2.050 is observed in GaP doped with 6 - 9 x 10¹⁷ S/cm . believed to arise from free electrons (or holes) in the conduction (valence) band. This ODMR is completely quenched due to non-radiative recombination in the vicinity of g - 1.99.
INTRODUCTION We have recently extended our magnetic resonance capabilities to include for purposes of studying optically detected magnetic resonance (ODMR) Some of the systems of defects in III-V compound semiconductors systems. particular interest with regard to defect studies are samples implanted with particular isotopes. For example, this technique may allow one to observe Other interesting the hyperfine structure of impurity donors in GaP. material systems are the strained layer superlattices and their interfaces. GaP is one of the III-V compound semiconductors of particular interest for In this paper we report the results of our preliminary ODMR ODMR studies. observations on as-grown sulfur doped GaP.
EXPERIMENTAL TECHNIQUES AND RESULTS
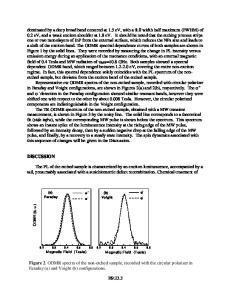
A schematic of the 20 GHz ODMR spectrometer used in these studies is shown in Fig. 1. The samples are illuminated with either a Ar laser or a This spectrometer is sensitive to the intensity of the dye laser. luminescence at magnetic resonance. As the result of a preliminary survey, we observed the ODMR spectrum shown in Fig. 2 from a crystal of n-type GaP doped with 6 - 9 x 10¹⁷ 3 sulfur/cm . This spectrum is observable under illumination with either the The ODMR signal is not 514.5, 488, or 457.9 run lines of the Ar laser. The observed under laser illumination at 800 nm (subbandgap light). intensity of this ODMR is maximum with approximately 50 mW of incident laser The peak in the luminescence power and 50 mW of incident microwave power. of this ODMR signal as deduced using narrow band interference filters the ODMR signal is is approximately 800 nm; however, (10 nm, FWHM) Ordinarily, observable at least between 680 and 1050 nm (no GaAs filter). only a GaAs filter was used to screen the optical detector from the laser radiation. This ODMR signal was detected using narrow-band lock-in This spectrum appears techniques and a liquid nitrogen cooled Ge detector. The isotropic with respect to the direction of the applied magnetic field. microwaves were square-wave chopped at typically 280 Hz.
DISCUSSION The dashed line in Fig. 2 is a Lorentzian curve least squares fitted to This the observed ODMR spectrum between 620 and 712 mT and 776 and 800 mT. Lorentzian curve is centered at 711.8 mT corresponding to a g value of 2.050 ± 0.003 with a linewidth (FW1-M) of 67.3 mT. Mat. Res. Soc. Symp. Proc. Vol. 163. ©1990 Materials Research Society
146
B field NMR
ODMR monochromator microwave source
computer
modulator
lock-in amplifier
detec
Data Loading...