Plaque geometry: determinant for fibrous cap stress levels
- PDF / 673,154 Bytes
- 2 Pages / 595.276 x 793.701 pts Page_size
- 62 Downloads / 261 Views
POSTER PRESENTATION
Open Access
Plaque geometry: determinant for fibrous cap stress levels Samuel A Thrysøe1*, Jens V Nygaard2, Anders K Niemann1, Nikolaj Eldrup1, Anette Klærke1, William P Paaske1, Won Y Kim1 From 2011 SCMR/Euro CMR Joint Scientific Sessions Nice, France. 3-6 February 2011 Introduction In clinical practice, the risk of cerebrovascular events originating from carotid atherosclerotic plaques is correlated to the degree of luminal narrowing, commonly designated the degree of stenosis. Though the degree of stenosis is a proven marker of plaque vulnerability, it is widely recognized that better risk markers for cerebrovascular events are needed. Known morphological features of plaque vulnerability are large lipid-rich necrotic cores (LR-NC) with thin fibrous caps that generate localized elevated mechanical stresses within the fibrous cap separating arterial lumen from LR-NC. Thus, determination of local biomechanics using computational simulations may have clinical implications.
analyzed with Matlab R2010a. Mechanical stresses were evaluated using a widely adopted critical threshold of 300 kPa below which the plaque is not considered at risk of rupture.
Results Significant differences were apparent comparing the two different patient morphologies using surface plots of degree of stenosis, peak principal mechanical stresses,
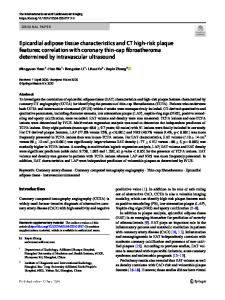
Objective Biomechanical stress levels could be indicative of plaque rupture risk. Thus, we wished to determine whether different plaque morphologies in a longitudinal section affects the level of local mechanical forces. Methods Two patients scheduled for carotid endarterectomy were scanned using MRI and idealized anatomical 2D models of individual carotid bifurcations were created (figure 1). Keeping the outer vessel wall constant, 3654 simulations were performed with varying morphological parameters in the form of patient geometry, fibrous cap thickness, LR-NC size, degree of stenosis, and blood pressure. The inner vessel wall and LR-NC boundaries were adjusted as needed to satisfy the requested morphology. The models were simulated employing fluid structure interaction analyses using COMSOL multiphysics 4.0a and 1
Aarhus University Hospital, Aarhus, Denmark Full list of author information is available at the end of the article
Figure 1 The two patient geometries simulated. Left: MRI scan, right: Computational model.
© 2011 Thrysøe et al; licensee BioMed Central Ltd. This is an open access article distributed under the terms of the Creative Commons Attribution License (http://creativecommons.org/licenses/by/2.0), which permits unrestricted use, distribution, and reproduction in any medium, provided the original work is properly cited.
Thrysøe et al. Journal of Cardiovascular Magnetic Resonance 2011, 13(Suppl 1):P376 http://jcmr-online.com/content/13/S1/P376
Page 2 of 2
Figure 2 Peak principal stresses as a function of the degree of stenosis and fibrous cap thickness. Blood pressure was 160 mmHg in all the simulations. The simulations were performed using identical morph
Data Loading...