Trends in Outpatient Prescription Drug Use and Related Costs in the US
- PDF / 85,464 Bytes
- 4 Pages / 505 x 720 pts Page_size
- 56 Downloads / 301 Views
SHORT COMMUNICATION
© 2006 Adis Data Information BV. All rights reserved.
Trends in Outpatient Prescription Drug Use and Related Costs in the US 1998–2003 Diane K. Wysowski,1 Laura A. Governale2 and Joslyn Swann1 1 2
Division of Drug Risk Evaluation, Food and Drug Administration, Rockville, Maryland, USA Division of Surveillance, Research, and Communication Support, Food and Drug Administration, Rockville, Maryland, USA
Abstract
Objective: To present a brief synopsis of trends in the number of prescriptions and retail costs of outpatient drugs dispensed in the US between 1998 and 2003. Methods: Data were extracted from IMS Health, the National Prescription Audit Plus™ and the National Disease and Therapeutic Index™ databases. Results: In 1998, 2.7 billion outpatient prescriptions were dispensed versus 3.6 billion in 2003. This equates to a 33.3% increase over the 6-year period. Of the top 20 most dispensed drugs by volume, 40% were launched in the 1990s or 2000s. Retail costs for the total market of dispensed outpatient prescription drugs were $US96.1 billion in 1998 and $US196 billion in 2003, a 104% increase. Of the top 20 most dispensed drugs by retail cost, all were tradename drugs and were launched in the 1990s or 2000s. Conclusions: These data indicate a large increase in the US over a short time period in dispensed outpatient prescriptions and their associated retail costs.
The number of prescriptions and their associated costs have risen considerably in the US. This article presents a brief synopsis of trends in the number of outpatient drugs dispensed in the US between 1998 and 2003.
Plus™ database.[1] Demographics of outpatient prescription drug users were obtained from the National Disease and Therapeutic Index™ database.[2] The databases are described elsewhere in more detail.[3] Results
Methods Two IMS Health databases were accessed to obtain nationally projected prescription data for the 6-year period 1998–2003. The number and retail costs of dispensed outpatient prescription drugs were obtained from the National Prescription Audit
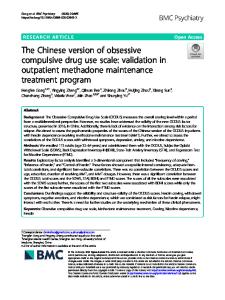
In 1998, 2.7 billion outpatient prescriptions were dispensed versus 3.6 billion in 2003, equating to a 33.3% increase over the 6-year period (figure 1). The 20 most dispensed drugs by prescription volume in 2003 are presented in table I. Of these, eight (40%) were launched in the 1990s or 2000s.
234
Wysowski et al.
Total prescriptions dispensed Total retail dollars
250
3.5 200 3.0 2.5
150
2.0 100
1.5 1.0
50
Total retail dollars (billions)
Total prescriptions dispensed (billions)
4.0
0.5 0
0 1998
1999
2000
2001
2002
2003
Year Fig. 1. Total dispensed prescriptions and retail dollars in the US, 1998– 2003.[1]
Retail costs ($US [billions], valued in the stated year) for the total market of dispensed outpatient prescription drugs were $US96.1 in 1998 and $US196 in 2003, a 104% increase (figure 1). In comparison, the general rate of inflation for goods and services between 1998 and 2003 was 13%.[4] The top 20 dispensed drugs in retail price in year
Data Loading...