Quantification and visualization of flow in small vessels of the Circle of Willis: time-resolved three-dimensional phase
- PDF / 206,052 Bytes
- 2 Pages / 595.28 x 793.7 pts Page_size
- 48 Downloads / 244 Views
WORKSHOP PRESENTATION
Open Access
Quantification and visualization of flow in small vessels of the Circle of Willis: time-resolved threedimensional phase contrast MRI at 7T compared with 3T Pim van Ooij1,2*, Jaco J Zwanenburg3,4, Fredy Visser3, Charles B Majoie1, Ed vanBavel2, Jeroen Hendrikse3, Aart Nederveen1 From 15th Annual SCMR Scientific Sessions Orlando, FL, USA. 2-5 February 2012 Background A promising technique to measure blood flow is timeresolved three-dimensional phase contrast MRI (PCMRI). In small structures as the Circle of Willis (CoW), the resolution of the measurement needs to be high (< 1 mm3). Image quality may be compromised when SNR decreases with increasing resolution which leads to blood flow direction uncertainty and flow quantification inaccuracies. To increase SNR, PC-MRI can be conducted at higher field strengths. In this study timeresolved 3D PC-MRI is performed in the CoW of five volunteers at 3T and 7T to investigate the advantages of increased SNR. Methods Examinations were performed on 5 healthy subjects. Retrospectively gated 3D PC-MRI was performed in an 8-channel head coil at 3T and a 16-channel head coil at the 7T MR system (both scanners Achieva, Philips Healthcare, Best, The Netherlands) at a resolution of 0.5 mm 3 . Imaging parameters: TE/TR: 4.1/8.6; flip angle: 20°; field of view: 180 x 180 x 20 mm3 (AP x RL x FH); velocity encoding: 150 cm/s x 150 cm/s x 150 cm/s; SENSE: 3. Background phase correction was performed by subtraction of the average phase in a static region of interest (amygdala). The lumen in both scans was semiautomatically segmented at all cardiac phases and in every slice in the fast field echo images using a level set evolution algorithm. The data was imported in GTFlow 1 Radiology, Academic Medical Center, Amsterdam, Netherlands Full list of author information is available at the end of the article
(Gyrotools, Zurich, Switzerland) to perform blood flow visualization. To allow for a voxel-wise comparison between the 7T and the 3T results, the 7T velocity information was registered and interpolated to the 3T data. Mean and standard deviation of the paired difference and the median of the angle between velocity vectors were calculated. Signal to noise was calculated in the amygdala.
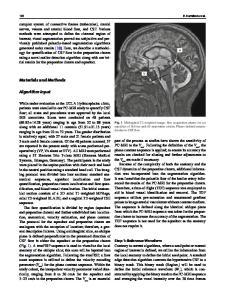
Results From table 1 it can be deduced that the SNR is a factor 2.7 higher in the 7T data. This gain in SNR allows for better segmentation and less noise in the velocity data, as can be seen in figure 1. At 7T it is visible that the flow through the Anterior Communicating Artery (ACoA, fig 1b) is from right to left, in the left Posterior Communicating Artery (PCoA, fig 1c) from Internal Carotid Artery (ICA) to Posterior Carotid Artery (PCA) and in the right PCoA (fig 1d) from PCA to ICA. Furthermore, note the upward flow in the anterior choroidal artery. Directions of flow are less obvious in the 3T data, due to increased noise or failure of segmentation. The noise in the 3T data results in a higher mean velocity, as shown by the positive mean of the paired differences in tab
Data Loading...