SI 3 N 4 Particle Removal Efficiency Study
- PDF / 295,667 Bytes
- 6 Pages / 414.72 x 648 pts Page_size
- 76 Downloads / 383 Views
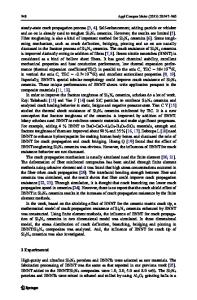
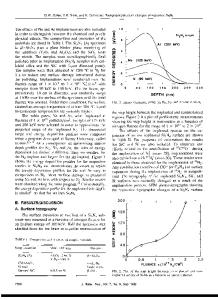
negative zeta potential will have a less repulsive interaction (electrostatic double layer repulsion) with the wafer. The method for depositing a uniform coating of silicon nitride particles on silicon wafers for this experiment is described in detail in a separate paper7 . Total particle counts on wafers are in 5000 range and particle sizes distribution are centered at 0.3 microns. FSI Mercury and SMS pre-gate cleaning bench were used in this experiment. Particles were measured on a Tencor 6400. Particle removal efficiency (%) is defined as: (Nbefo., Naftr)f/Nbfo x 100, where Nbf... and N.,, are the numbers of silicon nitride particles on the wafers before and after the cleanings. First, a screening experiment was employed to comparing Si 3N4 particle removal efficiencies among FSI BCLN, bench rinse with and without megasonics (800W), bench SC1/megasonic (800W), bench RCA, and bench RCA-based cleanings. Bench RCA cleaning recipe is following: S/P + Rinse + 15:1 HF @ 240C + Rinse + 10:1:1 SCI with 800W Meg. @600 C + Rinse with 800W Meg. + 5:1:1 SC2 @60'C + Rinse with 800W Meg. + IPA Dry The bench RCA-based cleaning recipe is following: 10:1:1 SC1 with 800W Meg. @600C + Rinse with 800W Meg. + 15:1 HF at 24°C + Rinse + 5: 1:1 SC2 @600 C + Rinse with 800W Meg. + IPA Dry The results of the screening experiment in Figure 1 shows that FSI BCLN, bench RCA, and bench RCA-based cleaning have very close removal efficiencies (around 99% removal efficiency). The expanded figure of these three cleanings in Figure 2 shows that for smaller size particles the bench cleanings are better than the FSI BCLN. Figure 1 also shows that the average particle removal efficiency of the bench SCl/megasonic only cleaning is around 85%. The particle removal efficiency of the bench R/D with megasonic is much higher (around 58%) than that of R/D without megasonic (around 0%). To optimize particle removal efficiency in RCA-based cleaning, a DOE has been done. Three factors were used in DOE: SCI temperature (40 and 600C), SCI concentration NH 4 OH:H 20 2:H20 (1:8:64 to 1:1:10), and megasonic power (1, 400, and 800W). The total numbers of runs and wafers are 12 and 36 respectively. Each run had three wafers. The multi-variable plot in Figure 3 shows the particle removal efficiency raw data for each single wafer and run of this DOE. Each dot in the figure is a wafer. It shows that most runs have high particle removal efficiencies and low data variability except a few runs. The details of the information in this figure was further analyzed in boxplot Figure 4, 5, and 6 in relations to the three factors. The boxplots show the median value, the upper quartile (the point containing 25% of the data points above the median), the lower quartile (the point containing 25% of the data points below the median), and outlier with case number"3 . The interquartile range (IQR) is obtained by subtracting the value at the lower quartile from the value at the upper quartile: IQR=Q(.75)-Q(.25) The upper adjacent value is the largest observation that is less than or eq
Data Loading...