Simulation of curvature-driven grain growth by using a modified monte carlo algorithm
- PDF / 1,419,885 Bytes
- 14 Pages / 613 x 788.28 pts Page_size
- 23 Downloads / 296 Views
I.
INTRODUCTION
T H E use of Monte Carlo (MC) technique to simulate grain growth evolved from the extension of the Ising model ~1'2Jthat was used for simulating systems with twofold degeneracy to systems having infinite degeneracy. Grain structures in metallic and ceramic systems exhibit infinite degeneracy, since there can be a large number of grain orientations in a finite volume of material. However, it was shown I31 in MC simulations that when the number of degenerate states was increased from a value of 2 (Ising model) to a number typically greater than 36, the simulation results approached the behavior of systems with infinite degeneracy. Grain growth simulations that use such a model have been well documented in the literature.i3 17] The simulations, when extended to twophase alloys, in which the second phase was a dispersion of insoluble particles t7] predicted the stabilization of grain size by the pinning of the boundaries by the insoluble particles. The technique has also been used to simulate abnormal grain growth, 19,1~ and primary recrystallization. ~101 A. The M C Grain Growth Algorithm
The algorithm used for simulating curvature-driven grain growth p-171 is as follows. A simulation domain of a suitable size (200 • 200) is chosen. Each of the points in the domain is assigned a random number Si between 1 and NQ, where N e is the total number of grain orientations. A grain is defined by a collection of points that have the same orientation number. NQ is typically greater than 36, above which the grain growth exponent becomes independent of NQ. I3'51 Each of the points is then accessed randomly, and the energy change associated with switching the orientation to another random value between 1 and NQ is calculated. The energy change is calculated by measuring the local energy of a cluster of lattice points before and after the switching process. The energy of the cluster of lattice points in defined as
B. RADHAKRISHNAN, Research Staff Member, and T. ZACHARIA, Group Leader, are with the Materials Process Modeling Group, Oak Ridge National Laboratory, Oak Ridge, TN 37831-6140. Manuscript submitted March 2, 1994. METALLURGICAL AND MATERIALS TRANSACTIONS A
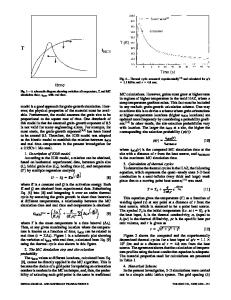
where J is a constant that is proportional to the grain boundary energy, 6ij is the Kronecker 6 function, Si is the orientation of the lattice point whose orientation change is being attempted, and Sj is the orientation of a nearest neighbor. The summation is taken over all the nearest neighbors. The probability of switching is based on the magnitude of the net energy change AE as a result of the switching process. The probability of switching is defined as follows: P=
1 exp(-Q/RT)
AE-0
[2]
The quantity T in Eq. [2] is not related to the physical temperature but is a quantity that is introduced to take care of certain lattice effects to be described subsequently. The simulation time is defined by a quantity known as the Monte Carlo step (MCS), which is related to the number of reorientation attempts. The MCS is equal to 1 when the number of attempt
Data Loading...