Solid solubility of carbon in a mechanically alloyed Cu-29.7 At. Pct Zn alloy
- PDF / 88,562 Bytes
- 2 Pages / 612 x 792 pts (letter) Page_size
- 34 Downloads / 274 Views
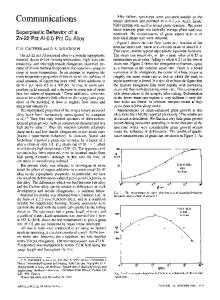
—X-ray diffraction patterns during mechanical alloying of Cu-29.7 at. pct Zn ⫹ 20 at. pct C mixture powders.
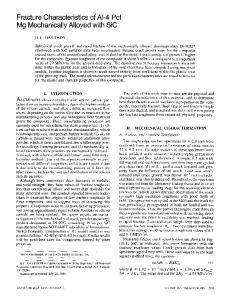
Fig. 2—Relation between lattice parameter of ␣ Cu-29.7 at. pct Zn phase and milling time.
angle 2 using the wavelength ⫽ 0.1540562 nm of Cu K␣1. The difference between the lattice constant calculated from the (111) peak and that from the (200) peak was only 0.00001 nm. The calibration of diffraction angle was performed by Si (220) and Si (111) peak angles 2 of Cu K␣1, which are 47.267 ⫾ 0.003 deg and 28.394 ⫾ 0.003 deg, respectively. So, the deviation from the standard lattice parameter at 2 ⫽ 42 to 43 deg is ⫾ 0.00003 nm. Carbon contents in the mechanically alloyed powders were chemically analyzed by the decomposition in the oxygen-infrared absorption measurement after washing well in ethanol. Figure 1 shows X-ray diffraction patterns of mechanically alloyed Cu-29.7 at. pct Zn ⫹ 20 at. pct C mixture powders. There are Cu-Zn(111), Cu-Zn(200), and graphite(0002) diffraction peaks in Figure 1. The graphite peak decreases with milling time, and Cu-Zn peaks shift to the VOLUME 32A, JULY 2001—1861
Table I. Chemical Compositions and Lattice Constants of Mechanically Alloyed Cu-29.7 At. Pct Zn ⴙ C Powders Mixed Compositions (At. Pct) Cu-29.7Zn Cu-29.7Zn Cu-29.7Zn Cu-29.7Zn Cu-29.7Zn
⫹ ⫹ ⫹ ⫹ ⫹
Chemical Analysis Carbon Compositions (At. Pct C)
Mechanically Alloyed Alloy Compositions (At. Pct)
Lattice Constant (nm)
9.5 18.5 28.5 38.5 48.5*
Cu-26.9Zn-9.5C Cu-24.2Zn-18.5C Cu-21.2Zn-28.5C Cu-18.3Zn-38.5C Cu-18.3Zn-38.5C
0.36746 0.36749 0.36759 0.37654 0.37654
10C 20C 30C 40C 50C
*Not washed in ethanol.
4. H. Araki, S. Saji, T. Okabe, Y. Minamino, T. Yamane, and Y. Miyamoto: Mater. Trans. JIM, 1997, vol. 38, pp. 247-54. 5. U. Mizutami, T. Takeuchi, and T. Fukunaga: Mater. Trans. JIM, 1993, vol. 34, pp. 102-08. 6. A.Y. Yermakov, Y.Y. Yurchikov, and V.A. Barinov: Phys. Metall. Metallogr., 1981, vol. 52 (6), pp. 50-58; Fiz. Metall. Metalloved., 1981, vol. 52, pp. 1184-93. 7. S. Saji, T. Kadokura, H. Anada, and K. Notoya: Mater. Trans. JIM, 1998, vol. 39, pp. 778-81. 8. R.B. McLellen: Scripta Metall., 1969, vol. 3, pp. 389-91. 9. Binary Alloy Phase Diagrams, T.B. Massalski, ed., ASM INTERNATIONAL, Materials Park, OH, 1990, vol. 1, pp. 839-40. 10. Binary Alloy Phase Diagrams, T.B. Massalski, ed., ASM INTERNATIONAL, Materials Park, OH, 1990, vol. 1, p. 899.
Secondary Hardening and Impact Fracture Behavior in Isothermally Aged Mo, W, and Mo-W Steels K.B. LEE, H.R. YANG, and H. KWON Fig. 3—Relation between lattice parameter of Cu-29.7 at. pct Zn alloy and solid solution concentration of carbon in ␣ Cu-Zn phase.
lower angle side with increased milling time. The peak shifts correspond to the increase in the lattice parameter of the Cu-Zn alloy. Figure 2 shows the changes in Cu-Zn alloy lattice parameters as a function of milling time. In all mixture powders, the lattice parameters increase and reach saturation values. Figure 3 indicates the relation between the lattice parameter and carbon content in solid solu
Data Loading...