Solubility of Hydrogen in Amorphous Silicon
- PDF / 470,667 Bytes
- 6 Pages / 414.72 x 648 pts Page_size
- 105 Downloads / 403 Views
= H 20 00
+ H 21oo
= A 2000 * 12000
+ A 2100 121,3o cm
3
(1)
Several studies have been published where A 2ooo and A2100 were determined by fitting Eqn. 1 to the hydrogen content obtained from Elastic Recoil Detection (ERD) for a series of films with varying strengths of the 2000 and 2100 cm- 1 mode. Fang et al. [4] proposed an equal proportionality factor for the two modes, A = 14 x 1019 cm-2; Langford et al. [5] two constants, A 2000 = 9.0 X 1019 cm- 2 and A 2100 = 22 x 1019 cm-2. These constants are very close to the constants proposed by Amato et al. [6]. Finally, Shanks et al. [7] proposed three constants. These differences were ascribed to different hydrogen bonding configurations in the films or to an error in the infrared data analysis [5]. We now point out that these pro419
Mat. Res. Soc. Symp. Proc. Vol. 377 0 1995 Materials Research Society
portionality factors were derived using the assumption that they do not depend on the hydrogen concentration. The proportionality constant of a mode i can be written as [8]: Ai = cnttwj/(2ir 2 e. 2)
m-2
(2)
where c is the speed of light, n the refractive index, ti the reduced mass, wi is the frequency of mode i and el the effective charge or oscillator strength of the dipole. This effective charge in the solid now differs from the effective charge in the gas because the vibrating dipoles are screened by the surrounding solid state. As the hydrogen concentration increases, the silicon concentration decreases. The amorphous network is becoming less dense and the screening decreases. There is thus no physical reason why the proportionality factors should be independent of the hydrogen concentration. In Fig. 1, we plotted the total integrated absorption of the stretching mode versus the S
5
](A) o
00. 100
.)
( 0) sputtered
( )
LPCVD
0"o 75 -,_(*)
a-Si:C:H
,-uC c
50 z
25-
S..."" S 0
solid line: This work
1_1_
1' 0
1 dotted line: 1 Fang , et al. 1 [4] , 5
15 10 HERD (1021 cm- 3 )
1 20
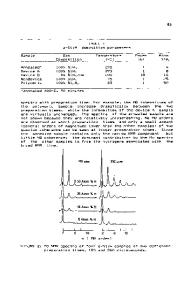
Figure 1: Integrated absorption of the stretching mode versus hydrogen content determined by ERD for various films. Data are from [5,6,9]. ERD hydrogen concentration. The data are from literature [5, 6, 9]. The series include films deposited by rf-deposition, magnetron sputtering, Low Pressure Chemical Vapour Deposition (LPCVD) and a-Si:C:H alloys. It is important to choose a wide range of deposition conditions because we have a range of data with different relative strengths of the 2000 and 2100 cm- 1 modes, while the hydrogen concentrations are similar. For example, the 2000 cm- 1 mode is much stronger than the 2100 cm- 1 mode for the magnetron sputtered films, while the strength of this mode is negligible for the carbon containing films. In contrast, it appears that the integrated strength depends on the hydrogen content only, irrespective if the hydrogen is bonded in the 2000 or 2100 cm- 1 mode. We thus have to conclude that A 2000 and A 2100 are equal but depend on the hydrogen concentration. To explain the behaviour of the strength of the stretching mode, w
Data Loading...