Spectroscopic Studies of Manganese Doped LaGaO 3 Crystals
- PDF / 409,843 Bytes
- 6 Pages / 415.08 x 633.6 pts Page_size
- 41 Downloads / 346 Views
Mat. Res. Soc. Symp. Proc. Vol. 602 © 2000 Materials Research Society
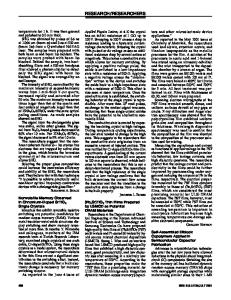
7A
-0.7-
~0.6-
o00.5-
IiI
.
. .
a
0.~32
0 350
..-.
850
1350
1850
3 210350
0.20.1-
6
01
2350
850
Wavelength, nrn
1350
1850
2350
1850
2350
Wavelength, nm
2000
50 X15
El1500
10000 C
12000- x
5.6
C
2 3
n500
.....
0..
350
50o
600
~
Wavelength, nm
__________
0
850 1100 1350 1600 1850 2100 2350
3
350
'm
850
1350
Wavelength,
Figure 1. (a) Room temperature absorption spectra of Mn4+ (1) and Mn3+ (2) in YAlO 3 . The estimated Mn3+ and Mn4+ concentrations (in the crystal) are =0.0125% (each). (b) Room temperature absorption spectra of strongly photoexposed (at X=514.5 nm) Mn:YAlO 3 at different directions of light propagation, polarization of the electric field and polarization of the magnetic field. The estimated Mn5+ concentration (in the crystal) is =0.02%. (c) Room temperature absorption spectra in LaGaO3. I - undoped, 2 - Mn=0.5%, 3 - Mn=2% (inner slice), 4 - Mn=2% (outer slice), 5 - Mn=l 0%, and 6 - Mn=50%. (d) Room temperature absorption spectra in 2%Mn:LaGaO 3 (outer slice) at different temperatures. 1 - 15TC, 2 - 70TC, 3 - 135TC, 4 - 145TC, and 5 - 190TC. ELECTRIC CONDUCTIVITY STUDIES The electric resistance of the crystals studied strongly depended on temperature. The temperature dependence of resistivity, p, could be described with the hopping model as p=BT exp(E/kT),
(1)
where B is the resistivity coefficient, T is the temperature, k is the Boltzman constant, and E is the activation energy. In our samples the coefficient B and the activation energy E increased significantly with decrease of Mn concentration. Thus, E changed from 336 meV in 50%Mn doped sample to 570 meV in 2% doped sample. The results of electric studies in Mn:LaGaO 3 will be discussed in detail elsewhere. ELECTRON PARAMAGNETIC RESONANCE STUDIES Manganese valence states 2+ and 4+ have an odd spin and can be observed by electron paramagneric resonance (EPR) technique. The EPR spectra of 0.5% and 2% manganese doped LaGaO 3 crystals contain multiple narrow lines corresponding to paramagnetic Mn2+ and Mn4+ ions, Figure 3. At Mn concentration equal to 10%, individual Mn2+ and Mn 4+ lines disappear and
108
"0.705606oL. w;0.40.30.2 0.1 0.0 640
1 _
0 1070
.
690
740 Wavelength, nm
790
1120
1170
1220 1270 Wavelength, nm
1320
1370
Figure 2. (a) Room temperature emission spectrum of Mn 4 + in 0.5%Mn:LaGaO 3 (1) and 0.5%Mn:YAIO 3 (2); (b) Emission spectrum of Mn 5 + in 2%Mn:LaGaO 3, T=300K, (1) and photoexposed 0.5%Mn:YAlO 3, T=77K (2). a single broad line forms instead, Figure 3. This broad line is due to coupling between neighboring Mn ions. It becomes significant at high Mn concentration. At Mn concentration equal to 10%, another new line with the g-factor equal to 2 appears in the EPR spectrum, Figure 3. It is getting more prominent in the crystal with 50% Mn concentration. This line resembles EPR signals typically observed in CMR materials in paramagnetic state [5]. In CMR materials, this signal is assigned to mixed M
Data Loading...