Structural Stability Diagrams for Thin-Film Multilayers
- PDF / 936,015 Bytes
- 6 Pages / 414.72 x 648 pts Page_size
- 57 Downloads / 401 Views
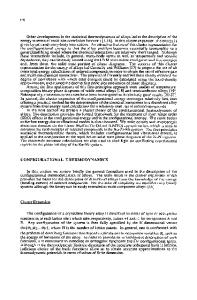
its stable structure (hcp) to a metastable structure (fcc) upon increasingthickness, and secondly the transition fromfcc/fcc to hcp/fcc multilayers upon increasing thickness does so with a decrease in misfit at the interfaces. Multilayers have been produced with either Al or Ti being the first layer to be deposited on the oxidized Si substrate, and the order of deposition has not resulted in any modification of the observed phase stabilities. Observations were generally made in the central portions of multilayers. The original Al/Ti observations were interpreted [6] on the basis of the R-Z model [10] with some success. However, more recent experiments have been performed in which the ratio of layer thicknesses has been deviated from unity. An example is illustrated in Fig. 1 by a high resolution transmission electron microscopy (HRTEM) image of a cross-sectional sample taken from a multilayer with thicknesses of the Ti and Al layers being 5.0 nm and 2.0 nm, respectively. In this sample, both the Ti and Al layers adopt the hcp structure. In contrast, for Ti layers of this thickness in multilayers for which the thickness ratio is unity, thefcc structure was adopted [6]. Since the R-Z model does not consider the effect of thickness ratio, this change in crystal structure for Ti layers of similar thickness, but from multilayers where the thickness ratio is varied, cannot be explained on the basis of variations in bulk stacking fault energies. Furthermore, the R-Z model cannot be applied to metallic multilayers (e.g. Co/Cr) with non-close packed structures, i.e. where the structural transitions (e.g. bcc
Data Loading...