The Ag-Au-Si system: Experimental and calculated phase diagram
- PDF / 530,461 Bytes
- 8 Pages / 594 x 774 pts Page_size
- 76 Downloads / 441 Views
I.
INTRODUCTION
THE aim
of this work is the comparison between the equilibrium temperatures deduced from calorimetric and differential thermal analysis measurements and those calculated from the thermodynamic data published for the binary (Ag-Au, Ag-Si, and Au-Si) and ternary systems. The three calorimetric techniques used to obtain enthalpies of formation and equilibrium temperatures already publishedtll are not reported in this paper. All the samples of Ag-Au-Si alloys were previously synthesized in the experimental cell of a very high temperature calorimeter; stoichiometric amounts of silver, gold, and silicon were dropped under purified argon atmosphere into the crucible in pure alumina. These alloys (of about 500 mg) were homogenized during many heating-cooling cycles. For the sake of clarity, we will briefly recall, in Section H, all the available necessary thermodynamic data concerning the Ag-Si, Au-Si, and Ag-Au-Si systems. A complete description of the third limiting binary alloy (Ag-Au) has been given in a previous article, tl~ In Section II are gathered all the data allowing the calculation of the ternary phase diagram. S. HASSAM, Maitre de Confrrences, formerly with Universit6 de Provence, is with Universit6 de Technologic de Compi~gne, Drp.arternent de Grnie Chimique, 60206 Compi~gne Cedex, France. J. AGREN, Research Associate, is with the Division of Physical Metallurgy, Royal Institute of Technology, S-100 44 Stockholm, Sweden. M. GAUNE-ESCARD, Director of Research, is with Syst~mes Energ6tiques et Transferts Thermiques, Centre de Saint-J~rrme, Avenue de l'Escadrille Normandie-Niemen, 13397 Marseille Cedex 13, France. J.P. BROS, Professor, is with Universit6 de Provence, Centre de Saint-Jrrrme, Avenue de l'Escadrille Normandie-Niernen, 13397 MarseiUe Cedex 13, France. Manuscript submitted August 4, 1988. METALLURGICAL TRANSACTIONS A
II.
EXISTING EXPERIMENTAL DATA
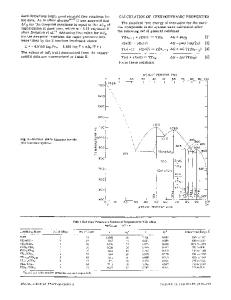
A. Ag-Si System 1. Phase diagram (Figure 1) This system exhibits a eutectic point (TE), the coordinates of which, proposed by Hansen and Anderko, t21 Hager, t31and Predel and Bankstahl, t4j are given in Table I. The liquidus temperatures have been recently determined by Hagert31 and Predel and Bankstahl. f4] The solid solubility of Ag in Si shows a maximum at 1623 K ( 4 " 10 -4 Ag mole pct). [2] The solid solubilitry of Si in Ag is also very restricted (1.3. I0 -s or 2- I0- Si mole pct at 1473 K). t2]
2. Enthalpy of formation The mixing enthalpies of the Ag-Si liquid alloys were determined using a very high temperature calorimeter.iS] These results obtained at 1400 and 1550 K can be represented by the following relation: mmixn(Ag_Si,liq) = Xsi(1 - Xsi )
9(32,132.8Xsi - 5014.4)
J.mo1-1
3. Activities Several authors using potentiometric and vapor pressure methods determined the activities of silicon and silver in liquid alloys. The results published by Hager, t31 Turkdogan and Grieveson, E6Jand Sakao and Elliottt71 are in good agreement.
B. Au-Si System 1. Phase diagram (Figure 2) This simple eutectic type equilibrium phase diagram
Data Loading...