The aluminum-strontium phase diagram
- PDF / 868,264 Bytes
- 4 Pages / 594 x 774 pts Page_size
- 41 Downloads / 451 Views
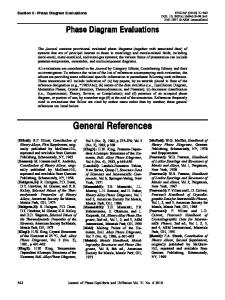
second. Typical cooling and heating curves are shown in Figure 1. In general, inflection points were more pronounced on the cooling than the heating curves and hence most data for determination of the liquidus lines were taken from the cooling curves. Heating curves were used mainly to conrLrm the existence of an inflection in the curve. The definition of the thermal arrests was particularly difficult to detect in alloys containing more than 90 wt pet Sr. Temperatures in this range are not good to more than -+2 ~ while those in the remainder of the diagram are felt to be accurate to +-l ~ Several experiments were repeated in an electric resistance furnace under vacuum, and results did not differ significantly from those obtained using the much simpler technique of induction melting under argon. Compositions were examined at approximate intervals of 2 wt pet across the system. In some cases they were spaced closer than this when it was desired to check a particular region. All samples were chemically analyzed for strontium. With repeats a total of about 75 thermal analyses was done. The reactivity in air and water of alloys containing more than 45 wt pet Sr makes metallography virtually impossible. Classical metaUographic techniques were used to examine some alloys in the higher aluminum end of the phase diagram; however, for phase identification X-ray diffraction was chosen as the only practical method. Diffraction using Cu Ka radiation in air at room temperature was done using an automatic diffractometer on flat surfaces of massive samples cut from the thermal analysis samples. Previous work gave no indication of metastable phases in this system, and hence it was decided to examine the as-cast rather than completely equilibrated samples. The thermal analysis
1100 1050 1000 950 9OO ~. hi t~
850 800
< t~ 750
:E
hi I-
700
850 600
550
O
150
300
450 6 0 0 750 9 0 0 1050 12OO TIME (SEC) Fig. 1--Typical cooling and heating curves. Alloy composition 61 pct A139 pet Sr. METALLURGICALTRANSACTIONSA
samples were stored under vacuum, and XRD was performed on them as soon as possible. The cut clean surface of the sample was protected by wrapping it in a polymeric paper (Saran Wrap~ ) during diffraction in order to prevent the formation of hydroxides. This technique worked extremely well in that no loss of line intensity occurred because of the paper protection and the paper produced its own known diffraction pattern consisting of only three peaks which did not interfere with peaks from the A1-Sr samples. The lattice parameters and crystal structures of the various intermediate phases are given in Table I from which it can be seen that excellent agreement exists between the present work and values reported by other authors. On completion of the experimental work the phase diagram was checked and refined by thermodynamic calculation of the liquidus lines using the Facility for the Analysis of Chemical Thermodynamics (EA.C.T.) System based at McGill University. This is an interactive computer based
0
740
ATOM PERC
Data Loading...