The clinical value of phase-contrast CMR mitral inflow diastolic parameters: comparison with echocardiography
- PDF / 193,031 Bytes
- 2 Pages / 595.276 x 793.701 pts Page_size
- 80 Downloads / 302 Views
POSTER PRESENTATION
Open Access
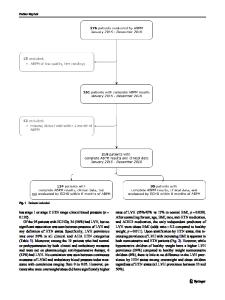
The clinical value of phase-contrast CMR mitral inflow diastolic parameters: comparison with echocardiography Emilie Bollache1*, Alban Redheuil2, Carine Defrance3, Ludivine Perdrix3, Benoît Diebold3, Elie Mousseaux2, Nadjia Kachenoura1 From 2011 SCMR/Euro CMR Joint Scientific Sessions Nice, France. 3-6 February 2011 Purpose To evaluate the ability of phase-contrast cardiovascular magnetic resonance (PC-CMR) blood flow diastolic parameters to characterize left ventricular (LV) diastolic dysfunction. Introduction Early detection of LV diastolic dysfunction is crucial for the management of patients with heart disease. PC-CMR is increasingly used for this evaluation. However, its usefulness in clinical routine is not established yet because of technical issues such as the lack of automated post-processing tools. We hypothesized that the analysis of velocity and flow-rate curves extracted from an accurate segmentation of the transmitral flow would provide sensitive diastolic parameters. Methods We studied 35 healthy controls (21 women; age: 38±16 years) and 12 consecutive patients (8 women; age: 81±5 years) with a severe aortic stenosis (valve area/body surface=0.47±0.17 cm2/m2, ejection fraction=66±16%, enddiastolic volume=94±18 ml, end-systolic volume=33±19 ml). All subjects had an echocardiography (GE Vivid 7) and a transmitral flow PC-CMR acquisition (GE 1.5 T) on the same day. For PC-CMR images analysis, we used our custom software for semi-automated segmentation of transmitral flow and automated extraction of diastolic parameters from velocity and flow rate curves. Flow rate curves provided: 1) peak filling rate (EfMR , ml/s) and
peak atrial filling rate (AfMR, ml/s) combined into EfMR/ AfMR, 2) peak filling rate to filling volume ratio (EfMR/ FVfMR, s-1), and 3) the deceleration time (DTfMR), while maximal velocity curves provided the early and late peak velocities EMR and AMR, combined into EMR/AMR. DTUS and EUS/AUS as well as the flow to tissue velocity ratio E US /E’ US were estimated from Doppler echocardiography.
Results A stronger correlation and a slope closer to 1 was found for the comparison between the echocardiographic EUS/AUS and the flow rate-related Ef MR/AfMR (r=0.80, EfMR/AfMR=0.89·EUS/AUS+0.09) than the velocity-related EMR/AMR (r=0.72, EMR/AMR=0.55·EUS/AUS+0.49). Results of receiver operating characteristic (ROC) analysis summarized in table 1 indicated the good sensitivity and specificity of the PC-CMR parameters to separate controls from patients.
Table 1 Summary of echocardiographic and CMR diastolic parameters for controls and patients and their ability to characterize pathological subjects. AUC=area under the ROC curve Controls
Patients
Sensitivity Specificity AUC
EUS/AUS
1.39 ± 0.60 0.82 ± 0.33 94
67
0.86
EUS/E’US
5.34 ± 1.83 14.3 ± 8.10 83
100
0.96
DTUS(ms)
180 ± 56
271 ± 58
77
92
0.86
EMR/AMR
1.34 ± 56
271 ± 58
77
92
0.86
EfMR/AfMR
1.44 ± 0.58 0.49 ± 0.20 91
92
0.95
DTfMR(ms)
187 ± 36
83
0.88
100
0.97
258 ± 45
86
11
Data Loading...