Thermal effects on the Raman spectra of nanodiamonds
- PDF / 234,739 Bytes
- 7 Pages / 432 x 648 pts Page_size
- 56 Downloads / 319 Views
Thermal effects on the Raman spectra of nanodiamonds Marc Chaigneau1, Hugues A. Girard2,3, Jean-Charles Arnault3, Razvigor Ossikovski1 1
LPICM, Ecole Polytechnique, CNRS, 91128 Palaiseau, France PMC, Ecole Polytechnique, CNRS, 91128 Palaiseau, France 3 CEA, LIST, Diamond Sensors Laboratory, F91191 Gif-sur-Yvette, France 2
ABSTRACT We report on the influence of the laser heating effect, potentially present in a Raman scattering experiment, on the behaviour of carbon phonon lines in the spectra of nanodiamond particles. Aside from the laser power used in the experiment, the extent of the thermal effect in question depends also on the nanodiamonds origin (obtained through detonation and high pressure high temperature techniques) as well as on the nanoparticles size. Laser heating should be properly taken into account when discussing Raman spectra of carbonaceous species, in particular, prior to addressing peak assignment and possible quantum confinement effects.
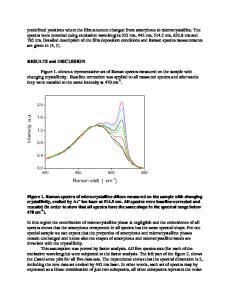
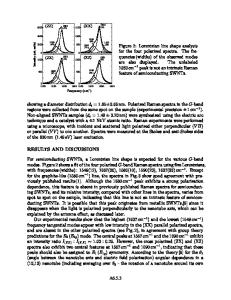
INTRODUCTION Raman spectroscopy is a powerful characterization technique widely used for discrimination of various carbonaceous phases. Indeed, graphite, amorphous carbon and diamond display distinct characteristic Raman features. Thus, for bulk diamond, the firstorder Raman spectrum exhibits a single sharp triply-degenerated line at 1332 cm-1 [1]. On the other hand, highly oriented graphite displays a single Raman first-order active mode at 1590 1600 cm-1, labelled "G band". For polycrystalline graphite, a second sharp band appears at about 1360 cm-1, called "D band". In the case of nanodiamonds (particles of size below 100 nm), each of the previous bands is reported. The diamond peak is typically broadened and presents a small shoulder downshifted to about 1250 - 1300 cm-1. These two modifications of the diamond Raman peak were previously explained by finite-size effects [2-8]. The presence of a band at ~ 1350 - 1380 cm-1 was assigned to D band corresponding to disordered graphite and/or amorphous sp2 carbon [9, 10]. The last broad peak lying in the 1500 - 1700 cm-1 range has different assignments depending on its origin. Generally, this broad band is labelled as corresponding to the conventional G band observed in graphitic materials [9]. Therefore, it has been tentatively assigned either to mixed sp2/sp3 bonding, pure sp2 bonding located in the outer shell of the nanoparticles [10], nanocrystalline graphite [11] or attributed to interstitial C=C pairs within the diamond lattice [12]. Whenever this broad band is significantly upshifted, the signal can result from surface species such as carbonyl or hydroxyl groups [13]. Most generally, this band can be also interpreted as being a superposition of several peaks of the previously mentioned contributions. High resolution TEM investigations emphasise the presence of amorphous carbon at the surface of nanodiamonds [14, 15]. Furthermore, XPS 53
and FTIR studies demonstrated the presence of various oxidized bonds at their surface [16, 17]. Experimentally, the laser-induced heating may modify nanodiamonds durin
Data Loading...