Thermodynamic studies and the phase diagram of the Li-Mg system
- PDF / 836,991 Bytes
- 10 Pages / 598 x 778 pts Page_size
- 108 Downloads / 491 Views
I.
INTRODUCTION
THE general features of the Li-Mg equilibrium phase diagram were given by Grube et al.[I] by means of thermal analysis and electrical conductivity measurements. Henry and Cordiano[2] and Saldau and Schamrayt31also using thermal analysis suggested the existence of a peritectic reaction, which was not confirmed by later studies of Freeth and Raynort4] and Schurmann and Voss. t51 There is a considerable number of references on the phase diagram I~-81 of the Li-Mg system, but the results obtained by various techniques are not in agreement. Hansen and Anderkotg] reported, for instance, two completely different sets of liquidus and solidus curves for the Li-rich side of the LiMg phase diagram, one based on Reference 1 and the other at considerably lower temperatures published by Freeth and Raynor. Phase diagram calculations of the Li-Mg system were initiated by Saboungi and HsuIt~ using thermodynamic data of the liquid alloys, t"j The results t~~ slightly exceed those of Grnbe et al. tll In 1984, Nayeb-Hashemi et al.[12] published a critical evaluation of the Li-Mg system, presenting an assessed phase diagram close to that of Grube et al., except for the Li-rich liquidus. In the same evaluation, ~2~ Nayeb-Hashemi performed phase diagram calculations usW. GASIOR and W. ZAKULSKI, Research Associates, and Z. MOSER, Professor, are with the Institute of Metallurgy and Materials Science, Polish Academy of Sciences, 30-059 Krakow, Reymonta Street 25, Poland. G. SCHWITZGEBEL, Professor, is with Institute of Physical Chemistry, University of Saarlandes, Saarbriicken D-6600, Germany. Manuscript submitted April 28, 1995. METALLURGICAL AND MATERIALS TRANSACTIONS A
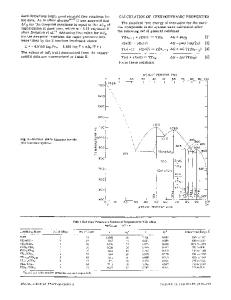
ing for liquid alloys electromotive force (emf) data, t113the calorimetrically measured heat of mixing, I131 and the previously assessed phase diagram. The main differences between their calculations and the assessed phase diagram concern both (Li) and (Mg) solvus curves and indicate the higher solid solubility of Mg in (Li) in comparison with data from the thermal analysis of Freeth and Raynor.t4] Also the higher solubility of Mg in (Li) has been reported by recent phase diagram calculations of Saunderst14j using the Lukas BINGSS optimization program.t15] Saunders has not considered for optimization the thermodynamic data of Langen et aLt~r] from emf measurements for liquid and (Li) phases and, similarly to Nayeb-Hashemi et al., did not accept for optimization the results of Schurmann and VosstS~ and the Li-rich liquidus of Grube et al. The equilibrium phase diagram of the Li-Mg system presented by Nayeb-Hashemi et al.t~2] consists of the liquid phase and the (Mg)-hcp and (Li)-bcc solid solutions. The phase diagram exhibits a maximum in (Li)-bcc liquidus, an eutectic, and retrograde (Mg) solvus. The main aim of our emf studies was to present new data for the liquid phase, as well as for (Li), (Mg) + (Li), and (Mg) regions, and to use them together with previously published thermodynamic and phase equilibria data for the phase diagram calculations. New e
Data Loading...