Crystalline Structure and Morphology of the Phases in MgO, TiO 2 and ZrO 2 Prepared by the Sol-Gel Technique
- PDF / 859,039 Bytes
- 6 Pages / 414.72 x 648 pts Page_size
- 6 Downloads / 442 Views
523 Mat. Res. Soc. Symp. Proc. Vol. 405 01996 Materials Research Society
TABLE I Parameters obtained from the Rietveld Refinement of the MgO crystalline structure as a function of hydrolysis catalyst and temperature Hydrolysis catalyst HCl HCI C2H20 4 C2H20 4 C 2H-402 C 2H4 0 2 C 2H4 0 2
C2H40 2 without without without without NH 4OH NH 4OH
Average T particle size (0c) (nm) 600 152(3) 900 156(3) 16.0(3) 600 900 43.0(3)
Lattice parameter (nm) 0.421032(2) 0.421022(2) 0.42161(2) 0.42119(6)
150 300
33.1(5) 33.2(7)
0.421704(6) 0.421663(7)
600 900 150 300 600 900 600 900
39.6(8) 0.421149(5) 0.421058(4) 63(1) 18.6(4) 0.42179(1) 19.8(4) 0.42170(1) 34.8(6) 0.42121(1) 78(2) 0.421064(4) 0.421179(9) 64(2) 87(3) 0.421014(8)
4
MgO-HCI-3
T-150c
I
~ T-3000C ..) >,
C
T - 600*C
JJ.
T * 9000C II
Il
I I
40
|
I
60
I
*
80
I I
100
120
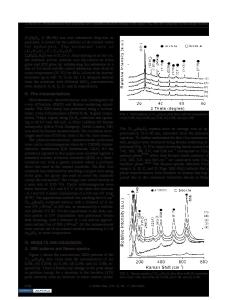
2&(degree) Fig.1 X-ray diffraction patterns of the samples prepared with HCl and annealed at temperature T. For T = 900 *Cthe Rietveld refinement plot is included.
Sample characterization X-ray diffraction. The crystalline structure of the samples was measured with a Siemens D5000 x-ray diffractometer, with CuKat radiation and a secondary beam monochromator. The structure of the nanophases was modeled with the same structure of the corresponding microcrystals. Starting with these models, each crystalline structure was determined by using the Rietveld technique and peak profiles containing the average crystallite size [10]. Transmission electron microscopy. Samples were ground and ultrasonically dispersed in distilled water. For obtaining the bright field images, drops of this mixture were deposited on a 200 mesh copper grid covered with a carbon film. RESULTS AND DISCUSSION MgO system. The samples prepared with a pH of 3 , 5 (with oxalic acid) and 9 contained nanophases of MgO only when they were heated at 600 'C (Fig. 1). When acetic acid was the hydrolysis catalyst, MgO was formed even in the fresh samples (Table I). This means that the hydrolysis catalyst determined the phases in the sample, not the pH. In the absence of hydrolysis catalyst, the phases in the sample were similar to, but smaller than, those found when acetic acid was used as hydrolysis catalyst. The initial phases in the fresh samples were modified by doping MgO with platinum. For example, when NH 4OH was used as a hydrolysis catalyst, the phases in the sample were platinum 524
64LT=
TiO 2-HCI-3 300 °C
OO.C
0 0 C.)
0
I 1
IAiilAIIAA II I11111IAIl
I I I IAlI I II
I ryIIIII
20
60
40
fll IIIAl IIII
m |
i|mlmU
|
Nu!ll IE111nl
m
tOO
so
120
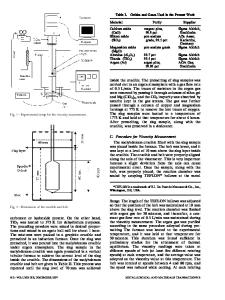
Two theta (degree) Fig. 2 TEM micrograph of a fresh
Fig. 3 Rietveld refinement plot of
I wt. % Pt/MgO sample.
titania sample prepared with HCO and annealed at 300 *C. It has brookite (lower tick marks), anatase (upper tick
marks) and rutile (middle tick marks).
nanocrystals and brucite needle-Eike nanocrystals (Fig. 2), which transformed into MgO after annealing the sample at 300 TC. TJ0 2 system. When titania was prepared by using the sol-gel techn
Data Loading...