Dielectric, Pyroelectric, and Thermal Properties of Solid Solutions of Ba (Ti, Zr)O 3 , Ba(Ti, Hf) O 3 , Ba (Ti, Sn) O 3
- PDF / 1,044,383 Bytes
- 9 Pages / 414.72 x 648 pts Page_size
- 34 Downloads / 442 Views
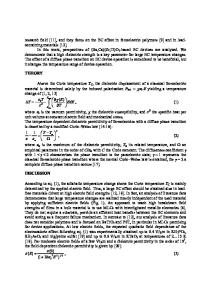
EDX analysis. The average grain size of each of the ceramic specimens was determined with the SEM at 5000x magnification. After the final calcining, each of these powders was examined with the powder x-ray diffraction to determine phase purity and unit-cell parameter for each composition. A least-squares fit of each set of diffraction data was used to determine unit cell parameters. 2. Property measurements Circular sample disks were gold electroded before either poling or electrical measurements. Before poling, each specimen was heated for 20 min above the high-temperature ferroelectric transition of the dielectric permeability. Efficient poling was then achieved by a slow cooling of the sample down to -30'C in a clean dielectric oil with an applied dc electric field of 10-12 kV/cm. The dielectric measurements were performed as a function of frequencies,f, using a QuadTec 1689 M LCR meter. The pyroelectric coefficient was determined by using the Byer and Roundy technique.The temperature range for both measurements was -20 to 160'C with a heating rate of 3°C/ min. The ramp linearity for the pyroelectric measurement was 0. PC for ramps of 3°C/min. The temperature variation of specific heat (Cp) was determined on a differential scanning calorimeter following the procedures described in reference [4]. RESULTS AND DISCUSSION 1.X-ray diffraction and scanning electron microscopy/EDX analysis A. Least squaresanalysis (XRD) Typical x-ray diffraction patterns taken on a sintered BaTiO 3 ceramic are shown in figure 1. Powder x-ray diffraction results indicate that each sample is a single perovskite. The values of the unit cell parameters ranged from 4.0023 to 4.0527 A. The crystal structure of pure BaTiO 3 was studied by x-ray diffraction [5]. Its unit cell parameter is lower than for the present ceramics, by as much as 0.9%. The theoretical density of each sample, which is calculated with the pseudo-cubic cell dimensions, is listed along with other characteristic parameters in table 1. W SIEMENSDIFFRAC 500 * * .•EE,
WFFT:.D
SATE:WDWTIF:
U)
(211)
(-3
10
(111)
(200)
"(100) 1. 14.00 6.321
18.80 4.716
i
I It __r_
7 23.60 5 3.767
(210)
8.40 3.?40
33.20 2.6=6
38.00 2.3W6
42.80 2.tit
47.60 .=00
52.40 1.0745
Two-Theta/D-Spacing (Cu-Ka) Figure 1. X-ray diffraction patterns for BaTiO 3 + 5.7% BaSnO 3. 128
57.20 0.606
62.00 1.46
Table 1. Density, grain size, and specific heat for doped barium titanate ceramics.
Composition BaTiO 3 ceramic BaTiO 3 + 3.5% BaZrO 3 BaTiO 3 + 12.6% BaZrO3 BaTiO 3 + 13.6% BaZrO 3 BaTiO 3 + 16.5% BaZrO 3 BaTiO 3 + 19.2% BaZrO 3 BaTiO 3 + 19.5% BaZrO 3C BaTiO 3 + 21.5% BaZrO 3 BaTiO 3 + 27.8% BaZrO 3 c BaTiO 3 + 3.8% BaHfO 3C BaTiO 3 + 11.5% BaHfO 3C BaTiO 3 + 13.0% BaHfO 3C BaTiO 3 + 1.2% BaSnO3 BaTiO 3 + 5.7% BaSnO3 BaTiO 3 + 11.2% BaSnO3 C BaTiO 3 + 13.0% BaSnO 3 BaTiO 3 + 13.8% BaSnO 3 BaTiO 3 + 4.4% Nd 2 Ti2 O 3 BaTiO 3 + 4.8% Nd 2 Ti 2 O 3
Theoreticala p (gm/cm 3 )
Actualb P (gm/cm 3)
Average grain size (pm)
Specific heat (J/gm.°C)
ND 6.045 6.063 6.065 6.071 6.072 6.077 6
Data Loading...