Dislocation Mobilities in NiAl From Molecular Dynamics Simulations
- PDF / 335,452 Bytes
- 6 Pages / 420.48 x 639 pts Page_size
- 88 Downloads / 409 Views
DISLOCATION MOBILITIES IN NiAl FROM MOLECULAR DYNAMICS SIMULATIONS A. MONCEVICZ, P. C. CLAPP AND J. A. RIFKIN Center for Materials Simulation, Institute of Materials Science, University of Connecticut, Storrs, CT' 06269-3136
ABSTRACT Using the Voter-Chen Embedded Atom Method (EAM) potentials for the Ni-Al alloy system, the Peierls stress (Op) and velocity of edge dislocations (b=[100]) have been estimated in stoichiometric perfectly ordered B2 NiAI at a temperature of 10 K, by the use of molecular dynamics simulations 2 0 0 employing approximately 4000 atoms. p was determined to be about 3x101 dynes/cm , or about 2% 5 of the shear modulus, C44. The steady state velocity was found to be about 1.6x10 cm/s (or 65% of 0 2 the (001) shear velocity) under an applied shear stress of 3.9x10I dynes/cm . Stress induced martensite (SIM) was nucleated in some of the simulations after the dislocation had begun to move, and in all cases when the SIM reached the immediate neighborhood of the dislocation core the motion of the dislocation was arrested.
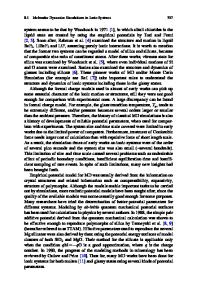
PROCEDURE The starting arrays of ordered bcc (B2) NiAl at 50-50 stoichiometry contained 4,096 atoms in an orthorhombus of 32x16x4 unit cells. Edge dislocations were produced by removing adjacent Ni and Al (100) planes in the upper half of the crystal, and then allowing the crystal to come to equilibrium after it spontaneously collapsed across the missing half planes. This created an edge dislocation with a Burgers vector equal in magnitude to the unit cell parameter (a0 =2.88 angstroms). The interactions used were the Voter-Chen EAM Ni-Al potentials (1], which have a range of about twice the unit cell dimension. Fig. 1 shows one unit cell thickness (or 25% of the total array) before and after equilibration. Periodic boundary conditions were used in the direction normal to the plane of the figure, but not in any other direction.
000 00 00 00&0 00*aaaaaaaaaa& 0 000 0 0 00000000a0000000
00
0.
&aO & & ooa&
o0&0 a....a a a a &&
.a
a.
a &
&a
& a
&
o ~* &00&00
aa
aaaa 0
~
aa~
0 00 0 0 &. 0
0 00 .. 00
0 000 0a0
0a0
*e@@S@@@Oe00000
*eO@@@@e@@@e@@0@ o& 0
0a0&0&0 0 00 &aaa a 0 000
o
oooooo
.aaaaa&
0&0ee 0000 aa
0
&
&&: a
aa~ 000
a*a&& a aa&e
aaaa 9&&a a
a
O000000e00@000000OO*OOOOO000000@
s1mE0
Figure la: Atomic position at start of simulation (before equilibration). Mat. Res. Soc. Symp. Proc. Vol. 209. @1991 Materials Research Society
ac
214
a0a040 aa. S& 0 &0 0.0a0
a a 0 0 0 0 &00
0&
0 000.
a
a* .040 a* a0a0 a* a0 &0a0 &0 0 .a& 00&a 0a a aOO
a 00
a0a
00
0.
00
*0 00&&**&0& 41&0 040& &
10
&0&0&0&0 &Th0&00~
*0 0
0
0
00
00
0&0&
&0&&%a0 &0&&0 a0 &000 &00&:0&0&0&0&0&00.&.0 LO
&0
& a0&o & 0 &.
a. a.
&. & .&:.&.
STU, 2000
Figure 1b: Atomic positions after equilibration (T marks dislocation).
Equilibration of the considerable potential energy released during the edge dislocation formation event was achieved with molecular dynamics runs of up to 2000 steps using a "clamped" temperature of 10 K. The "clamping" subroutine rescaled all
Data Loading...