Influence of Doping on the Lattice Dynamics of Gallium Nitride
- PDF / 109,294 Bytes
- 6 Pages / 612 x 792 pts (letter) Page_size
- 36 Downloads / 358 Views
oaded from https://www.cambridge.org/core. IP address: 89.191.226.142, on 30 Apr 2020 at 15:08:45, subject to the Cambridge Core terms of use, available at https://www.cambridge.org/core/terms. https://doi.org/10.1557/S1092578300002672
The samples under study were Si-, C-, and Mg-doped GaN films of about 1 µm thickness grown on sapphire (0001) substrates by MBE; the details are given elsewhere [7]. The Mg-doped samples A and B were p-conductive with a hole concentration at room temperature of 3.7⋅1017 cm-3 and 1.4⋅1017 cm-3, respectively, whereas the other two samples were compensated but n-conductive. Secondary ion mass spectroscopy was applied to determine the concentration of magnesium and hydrogen. The measured concentrations are accurate to within 20% deviation. The dopant concentration of the Si- and C-doped GaN films were estimated in terms of growth conditions. The free-electron concentration in the Si-doped samples varied from 8.1⋅1015 cm-3 to 1.3⋅1020 cm-3 as determined by Hall measurements. Results 1. Local vibrational modes in doped GaN
2219
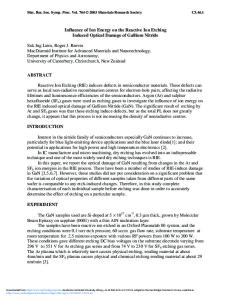
2185
2129 2148
Scattering Intensity (arb. u.)
2166
Figure 1 shows Raman spectra of samples with the respective magnesium concentrations of 8⋅1019 cm-3 (A), 1.2⋅1019 cm-3 (B), 9⋅1018 cm-3 (C) and 6⋅1018 cm-3 (D) in the high-energy region. In the spectrum of sample A with the highest magnesium concentration a new mode appears at 2129 cm-1 in addition to the four LVM described in Ref. 5. Apparently, the intensity of the modes correlates with the magnesium content. A Mg-concentration of around -3 1⋅1019 cm-3 is necessary for some of the high-energy modes [Mg]/cm A 19 to appear well-resolved in the spectra. The hydrogen 8*10 concentration for all the samples investigated is about B 19 1⋅1019 cm-3 as determined by secondary ion mass 1.2*10 C spectroscopy. Since hydrogen was not intentionally 18 9*10 supplied during growth its incorporation possibly arises D from the residual water vapor pressure in the growth 18 6*10 chamber. Yi et al. [8] observed a similar structure of five modes 2100 2150 2200 2250 2300 around 2800 cm-1 in Mg-doped GaN grown by -1 metalorganic vapor phase epitaxy (MOVPE). These modes Raman Shift (cm ) Figure 1: Room-temperature Raman spectra were attributed to symmetric and asymmetric C-Hn of GaN with different magnesium content in (n=1, 2, 3) vibrations due to carbon incorporation caused the high-energy range. by the decomposition of the magnesium precursor during growth. Remarkably, the frequency ratio for all the five modes is between 1.33 and 1.34. This is close to 2 , a value expected for similar vibrations with carbon (mC=12.01 u) replaced by magnesium (mMg=24.31 u). This implies that magnesium is built into the lattice on a nitrogen site with force constants similar to those of carbon, an interpretation which seems doubtful. Furthermore, there are experimental and theoretical articles that determined the frequency of the Mg-H vibration above 3000 cm-1 [5, 9]. Alternatively, hydrogen-decorated native defects or hydrogen at extended defects
Data Loading...