Influence of SiO x Capping Layer Quality on Impurity-Free Interdiffusion in GaAs/AlGaAs Quantum Wells
- PDF / 831,518 Bytes
- 12 Pages / 418.68 x 637.2 pts Page_size
- 54 Downloads / 393 Views
130 QW4 (950*C - 60 s)
SW>120
880
7 70
E 110
I-u
60 50
-i- loo
8% go =_
U
80
o
80 sccm
a
160 sccm
v o
320 sccm 480sccm
ti 90- '4=
simulation
'V5 30 o 0.
10
70 1
2
3
4
5
6
0
100
200
300
400
500
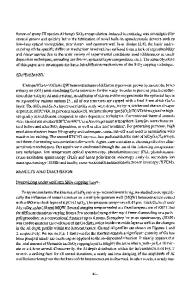
SiH 4 Flow Rate: M (sccm) Figure 5. Variation of deposition rate as a function of silane flow rate.
Diffusion Coefficient: D (x 10-16 cm2/s) Figure 4. Variation of energy shift in QW4 with diffusion coefficient for different M 495
20
-a3
15
N
10
0.8
Energy (MeV) 1.0
1.2
1.4
5
E 0
z 5
0 Channel
Energy (MeV) 20
Figure 6. RBS spectra from SiO layers deposited using (a) 40 sccm, (b) 160 sccm, or (c) 480 sccm Sill4. The solid lines correspond to simulations of the structures shown in insets.
15
10
N
E 0
-
5
0 Channel
20
0.8
Energy (MeV) 1.0
1.2
1.4
20 15 >._0 a)
N 10 0
E 0 z
5
0 Channel
496
likely mechanism for the formation of plasma deposited SiO, proceeded via a two-reactant surface chemistry involving the replacement of hydrogen in disiloxane [(SiH 3)20] by free oxygen radicals [21]. Since depositions were performed under constant pressure, the resident time of N20 (and hence, 0 radicals) decreases with increasing M, causing a decrease in KM. The same argument can also be used to infer that SiO, films become oxygen deficient in the high SiH4 flow rate regime. The variation of oxygen content in capping layers with M was determined by RBS. Random and channeled RBS spectra obtained from SiO, films deposited using 40 sccm (a), 160 sccm (b) and 480 sccm (c) SiH4 are depicted in Fig. 6. The solid curves in Fig. 6 correspond to RUMP simulations of the structures shown in insets [22]. For instance, the results shown in Fig. 6(a) reveal that the dielectric layer deposited using M = 40 sccm had the over-stoichiometric composition SiO 2.2, while films deposited using M = 160 sccm [Fig. 6(b)] were stoichiometric. The RUMP simulation in Fig. 6(c) illustrates that the oxygen content in a -450 A thick SiO1 layer for M = 480 sccm was linearly graded with x = 2 at the surface and x = 1.2 at the E/H-interface. The capping layer also contained a constant concentration of nitrogen (SiOxNO. 4). The RBS results depicted in Fig. 6 provide clear evidence for the decrease in oxygen content in SiO, layer with increasing M, and correlate with the results shown in Fig. 5. Figure 7 illustrates IR transmission spectra for dielectric layer deposited using 40, 80, 160, 320 and 480 sccm Sil-4 [curves (a), (b), (c), (d) and (e), respectively]. The three bands labelled S1, S2 and S3 correspond to the in-phase stretching (-1040-1075 cmi'), bending (-800 cm-'), and rocking (-465 cm-) vibrations of the Si-O-Si linkage [23]. The shoulder on the high frequency side of S I is the out-of-phase component of the Si-O-Si stretching peak. The intensity, position, and profile of the S I peak is dependent on the Si to 0 ratio and varies with deposition conditions of capping layer. Two pertinent remarks can be made concerning the S I peak. Firstly, the S I peak becomes broader with increasing M indicating
Data Loading...