Microscopic Role of a Surfactant in Epitaxial Crystal Growth
- PDF / 302,444 Bytes
- 6 Pages / 414.72 x 648 pts Page_size
- 94 Downloads / 317 Views
THEORETICAL APPROACHES The surface is simulated by a periodically repeated slab of Si atoms in which six atomic layers (each layer with (4x2) surface unit cell) are included, with the bottom surface terminated by hydrogens to saturate dangling bonds and the top surface followed by a vacuum region of 8 A. Two bottom Si layers and additional H layer are fixed to prevent any spurious forces by the H atoms. Our calculations have been carried out using Car-Parrinello molecular dynamics approach[18]. The interaction between ionic cores and valence electrons is described by a fully nonlocal norm-conserving pseudopotential with s nonlocality for Si [19]. The H atom
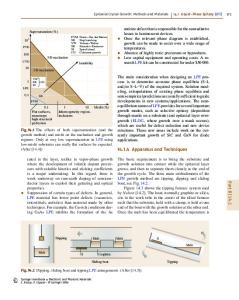
is treated by the local pseudopotentials. The electronic wavefunctions are expanded with a kinetic energy cutoff of 8 Ry and the Bloch functions at F point of the supercell surface Brillouin zone are used exclusively. Careful convergence test was done. We estimate the energy difference between different adsorption points to be approximately 0.1 eV. RESULTS AND DISCUSSION The diffusion of the Si adatom on the clean (without hydrogen) Si(001) surface is anisotropic due to the dimerization, leading to the step growth (20]. One may wonder how the diffusion process of an adatom changes on hydrogenated surface. In this study we choose one monolayer of the H atoms on Si(001) surface to form a monohydride phase. With one monolayer of the H atoms on buckled p(2x2) surface, the buckling is completely removed and the surface becomes (2 x 1) phase. Bond lengths of the dimer and Si-H bond are 2.41 and 1.55 A, respectively, comparable to 2.40 and 1.54 A of the previous pseudopotential calculations [21]. We now add a single Si monomer on monohydride surface to find the stable adsorption sites. The Si adatom is initially added on the surface at the relative distance of at least 2.8 A away from the adjacent surface Si atoms. In order to draw the adsorption potential energy surface, we divide a quarter of the surface primitive cell by 15 mesh points. The spacings between mesh points are 0.91 and 0.97 A in the x- and y- directions. For a given planar point, the adatom is allowed to move in the z- direction, while relaxing all the atoms in the four sublayers. The potential energy surface of Si adatom is shown in figure 1. Presence of the hydrogen atoms modifies notably the potential energy surface from the clean surface. The adatom prdfers to adsorb at the H', M2 (new adsorption positions), and the M 1 near the dimer in the trough, different from the H and M points on clean surface [20].
268
0.00
2.00
4.00
6.00
/
4.08
4.08
oM
2.08
0.08
0.08
-1.92
-1.92 0.00
2.00
4.00
X (A)
6.00
Figure 1: The potential contour plots of a Si monomer adsorption on monohydride Si(001) surface. The energy difference between contour lines is 0.1 eV. Values for the potential are taken with respect to the H point. The H', M 1. and M 2 points are adsorption sites. The H and M are shown for comparison with adsorption sites on bare Si surface. The D is a saddle point and A is a barrier po
Data Loading...