Optical and Magnetic Properties of Silica Implanted with N + and Fe +
- PDF / 305,154 Bytes
- 6 Pages / 414.72 x 648 pts Page_size
- 17 Downloads / 305 Views
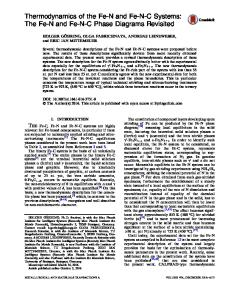
e active sites to react with the second species. Application of ionimplantation with multi-components is, therefore, a feasible method to produce non-equilibrium materials. Iron nitride, a"-Fe1 6 N2, with a giant saturation magnetization, -300emu g-', is one of the attractive ferromagnetic materials [3,41. It is, however, difficult to synthesize by conventional thermal treatment . Nakajima et al. reported that a"-Fe16N2 can be formed on implanting N into an Fe film, using multiple energies to fit the stoichiometry [3,41. In the present study, we examine the chemical interaction between implanted N and Fe in silica glass by optical absorption and ferromagnetic resonance absorption spectroscopies. EXPERIMENTAL Silica glass plates (Corning, 7940-excimer grade) were implanted sequentially with N' at 52 keV to different doses, ranging from 0 to 1.2x10¹⁷ ions cm 2 , and then with Fe' at 160 keV to 6x10"6 ions cm-2 at room temperature and 4 ltA cm-2. In order to investigate the effects of the order of implantation, silica was also implanted in the reverse order, i.e., with Fe' and then with N'. Depth profiles of the Fe concentration were measured by the backscattering technique using a 2.3 MeV 4 He' beam. Optical densities were measured from 850 nm (1.4 eV) to 190 nm (6.5 eV) at intervals of 0.5 nm by a dual beam spectrometer (JASCO, V550), using an unimplanted silica glass as a reference. Ferromagnetic resonance (FMR) absorption spectra were measured at room temperature at 9.4 GHz by a spectrometer (JEOL, JES-RE3X). The applied magnetic field was modulated at 100 kHz to obtain the first derivative of the resonance absorption signals as a function of magnitude of field. The angular dependence of the FMR signals was investigated by rotating the sample holder to an angle, 0, between the applied magnetic field and the normal to the implanted surface. The resonance magnetic field, I-k(0), was determined from the point where the derivative curve changed sign. RESULTS Depth Profile of Implants The energies of N' and Fe', at which the depth profiles of both ions overlap, were calculated by TRIM89 [5]. As shown in fig. 1, the simulated depth profiles of N and Fe are very close, when silica is implanted with N4 at 52 keV and with Fe' at 160 keV to the same doses. Fig. 1 also shows the experimental depth profiles of Fe, measured by ion backscattering, for silica implanted with N' and Fe' to doses of 6x10 16 ions cm-2. It is recognized that the simulated and experimental profiles are similar. The N depth profile could not be resolved by backscattering, since the Rutherford cross section of N is less than those of 0 and Si, and the amount of N is very small compared to those of 0 and Si.
412
10"1 6
Simulation o o 0
+ N (52 keV) 0 Fe (160 keV) IExperiment *Fe (160 keV) -2
4
0. a
o9
2:1
"0
5E
t+
-
°
"
°
00 ,•
+
.
'•
3
""000
-. 0 0
100 Depth
150
200
250
Fig.I Depth profiles of N and Fe implanted into SIO_.
0 0
"O 1
50
c
2
TRIM simulation: + N (52 keV), 0
Fe(160keV).
Experiment: 0 Fe(160keV, 6xlO'1' ions
Data Loading...