Physics-Based Intrinsic Model for AlGaN/GaN HEMTs
- PDF / 247,549 Bytes
- 6 Pages / 612 x 792 pts (letter) Page_size
- 55 Downloads / 298 Views
1)
1 Downloaded from https://www.cambridge.org/core. IP address: 31.148.221.1, on 13 Jun 2018 at 15:35:18, subject to the Cambridge Core terms of use, available at https://www.cambridge.org/core/terms. https://doi.org/10.1557/S1092578300003409
E F = E F ( 0 ) + γ ⋅ ln( n s )
(eV)
(2)
where the constants a, b, EF(0) and γ are determined from the results of the quantum calculation. The drain-source current Ids can then be written as [5] : I ds =
2 G0 VT s + s2 − p 2 γ 2 s 2 p2 2 −1 p ln( )+ cos ( ) ⋅( s − p2 − s − p − p ⋅ ε 0 L1 2 2 p VT s
(3)
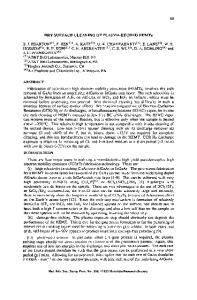
where G0 = εZvs/deff, deff = d + ∆d with d and ∆d being the thickness of AlGaN layer and effective channel thickness, respectively. Z is the width of the gate and L1 is the length of unsaturated region of the channel. The above equation incorporates the effect of the quantum well through eqs. 1 and 2 via reduced potentials, s and p. Also implicit in eq. 3 is the use of a velocity-electric field characteristic of the form vd=µ0 E/((vs/µ0)2+ E)1/2 where vd is the drift velocity, µ0 is the low field mobility, vs is the saturation velocity and E is the electric field. The velocity-electric field characteristics are obtained from an ensemble Monte Carlo simulation using the following scattering mechanisms: acoustic phonon, optical phonon, intervalley, alloy, ionized impurity and piezoelectric scattering The evaluation of dc and small signal parameters follows the treatment presented in Ref. [5]. RESULTS AND DISCUSSION The QW formed in GaN in an Al0.25Ga0.75N/GaN heterostructure is considered. The electron effective masses in GaN and AlN are assumed to be 0.19m0 and 0.23 m0, respectively, where m0 is the free electron mass. The electron effective mass of Alx Ga1−x N is obtained by a linear interpolation between the values for GaN and AlN. Based on a calculated valence band offset in AlxGa1-xN/GaN, it is found that the conduction band offset may be given as: ∆E c = 0.75∆E G , where ∆E G is the difference in bandgaps of GaN and Alx Ga1−x N [5]. The −4 2 temperature dependent bandgap for GaN is given as E GaN G ( T) = 3.056 + 5.08 × 10 T / ( T − 996) [9]. The bandgap of AlN is assumed to be 5.1 eV. Fig.1 shows the conduction band profiles obtained by solving the Schrödinger and
Electron Energy (eV)
0.4 T=300K T=500K
EC
0.3
0.2
2DEG Distribution 0.1
0 -50
0
50
100
150
200
250
300
Distance (Angstrom) Fig. 1 Conduction band profile and 2DEG concentration at 300K and 500K. 2 Downloaded from https://www.cambridge.org/core. IP address: 31.148.221.1, on 13 Jun 2018 at 15:35:18, subject to the Cambridge Core terms of use, available at https://www.cambridge.org/core/terms. https://doi.org/10.1557/S1092578300003409
Poisson's equations self-consistently for 300K and 500K. On the same plot the 2DEG distributions are also plotted. The plots are obtained for a 2DEG concentration of 18 . × 1012 cm −2 and the corresponding positions of the Fermi level are 0.092 eV and 0.052eV above the tip of the conduction band discontinuity at 300K and 500K, respectively. The conduct
Data Loading...