Pulsed-Light-Induced Metastable Defect Creation in Hydrogenated Amorphous Silicon
- PDF / 344,521 Bytes
- 6 Pages / 414.72 x 648 pts Page_size
- 39 Downloads / 386 Views
2 by using uniformly absorbed light (X=650+20 nm) with an illumination intensity of 3 mW/cm filtered through a band pass filter from a tungsten-halogen lamp. The subgap defect density was 9 measured by the constant photocurrent method(CPM) using a conversion factor of 1. x 1016 cm-2 eV-1. For the annealing experiments, the sample was attached using high thermal conductive paste to a thermoelectric heater/cooler. The sample temperature during dark- and light-annealing was controlled within ± 0.5 °C accuracy.
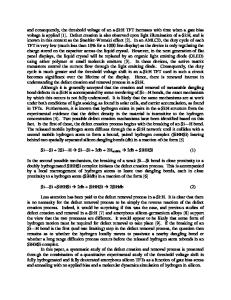
RESULTS AND DISCUSSION Defect generation by pulsed laser light soaking at room temperature was studied. The defect density was measured as a function of illumination time for different samples and light intensities. Samples were annealed for 2 hours at 180 °C prior to degradation. Figures 1 and 2 show the illumination time dependence of the defect density Nd for different light intensities and samples, respectively. In Fig. 1, The sample was prepared at substrate temperature 270 OC and had asgrown defect density of 6. 1x10 15 cm- 3 . The intensities were varied by changing only the averaged pulse energy without changing the defocused laser beam size of about 1 cm 2 and the pulse duration. After the entire measurement at each intensity was finished, the sample was also annealed for 2 hours at 180 oC for next measurement. While in Fig. 2, the samples were prepared at substrate temperatures Ts, 190, 250, 270 oC, keeping other deposition conditions unchanged. As-grown state defect densities were 8.8x101 5 , 6.8x10 15 , 6.1x10 15 cm- 3 , respectively. The light intensity of 300 mW/cm 2 was used for the defect creation. 1 o18 []
30 mJ
*
5 mJ 2 mJ
o
E
0 ADd2 Sin
1 017 C
U'
E3
-3 0
'I-
V
a0
1o
16
S.. :::...
-
-
--" "L --
-Er,
- --
--
I.......I .......
I
-
t1/2
I 1 01 5
S. I . ....... . .... P 101 10 0 i i i ii iU
_. . . . . . ...
10 2
. . . . . . ...
. ,. .. ,,,.,I .
103
10 4
10 5
Illumination Time (sec) Figure 1. Time dependence of the pulsed-light-induced defect density for different intensities. The dotted lines indicate stretched-exponential fits to the data and the solid line represents the t112 dependence for comparison. 374
10 1 8
T T
E
% U
190
*
250
0-
S v
w
,If
III
l' .. I04-WI .43-
-
,-
o"
270
o
1017
(°C)
El
13062 7.--
o-
-Ur
-
33/
1
300 mW/cm 2 1 01 5
I
.I
I
101
100
. ..1 I
102
..
.I
1 03
.. II1l..
I
10 4
[I II[[[
1i05
Illumination Time (sec)
Figure 2. Time dependence of the pulsed-light-induced defect density for samples prepared under different substrate temperatures. The dotted lines indicate stretched-exponential fits to the data and the solid 1 2
line represents the t / dependence for comparison.
The data show a sublinear increase in defect density, reaching an eventual steady state. The defect creation kinetics seem to be independent of the light intensities and samples as shown in Figs. 1 and 2. This kinetics are also similar to those observed in the defect creation by cw light or current[3,1 1]. We have fitted the dat
Data Loading...