An X-ray diffraction line profile analysis in cold-worked Fcc Cu-1Zn-Sn and Ag-1Zn-Sn alloys: Role of 1 wt pct Zn
- PDF / 956,905 Bytes
- 4 Pages / 594 x 774 pts Page_size
- 2 Downloads / 287 Views
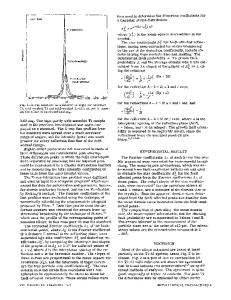
Communications An X-Ray Diffraction Line Profile Analysis in Cold-Worked Fcc Cu-lZn-Sn and Ag-lZn-Sn Alloys: Role of 1 Wt Pct Zn A.K. MAITY and S.P. SEN GUPTA The role of addition of 1 wt pet Sn to fcc Cu-Zn u] and Ag-Zn t2] alloys has been investigated earlier, and the significant observations with regard to the addition of a third element in the dilute range have been reported. The present investigation concerns two other alloy systems, namely, the solid-solution phase of Cu-Sn and Ag-Sn having solute Zn in the dilute range of 1 wt pct only. Spectroscopically pure (99.999 pct) metals, supplied by M / S Johnson, Matthey, and Co. Ltd. (London), were used to prepare five compositions of Cu-I wt pct Zn-Sn alloys and also Ag-1 wt pct Zn-Sn alloys in the solidsolution range; the X-ray diffractograms from respective cold-worked and annealed standards were recorded in the usual way. t3] The recorded diffractograms were subjected to detailed profile analyses for peak shift, peak asymmetry, and peak broadening following the standard methods adopted earlier, t41 The average values of the stacking fault probabilities, (Ups), have been determined from measurements of relative peak shifts, t41 and the reflections involved are (111), (200), (220), and (311). The values are shown in Table I, and the variations of the (Ups) with solute Sn concentrations in weight percent are shown in Figure 1.[3.5.6] It is apparent from Figure 1 that the fault probabilities (Ups), in general, increase rapidly with the addition of solute Sn, and the addition of dilute solute 1 wt pct Zn to binary alloys of Cu-Sn and Ag-Sn helps to increase the frequency of faulting, which is identical to observations made in Ag-lSn-Zn alloys t21 and unlike the case with Cu-lSn-
6C
/_,~
o co-,o
"~
e,.,.o.,/ye
V2c
I
0
A.K. MAITY, Senior Research Fellow, and S.P. SEN GUPTA, Professor and Head, are with the Department of Materials Science, Indian Association for the Cultivation of Science, Jadavpur, Calcutta 700 032, India. Manuscript submitted October 11, 1989.
Table I.
~p~,
o Cu-tZn-Sn'[,~r t w "3 v Ag-lZn-Sn.J ~ esen OrK /~ 9 Ag-Sn (Adler&Wagnermez) /,,~ / Cu-Sn {Wagner& He'lionlges) /_~" / •
I
4
I
8 Wt % Sn
t2
Fig. 1--Plots of average stacking fault probability, (aps), as a function of solute concentration (weight percent) in Cu-lZn-Sn, Ag-lZnSn, Cu-Sn, and Ag-Sn alloys.
Experimental Values for Cu-1 Wt Pct Zn-Sn (Upper) and Ag-1 Wt Pct Zn-Sn (Lower) Alloys (aps) x 103
(/3 + 4.5t~") x 103
3
6.6
-1.2
6 9 12 15
20.5 28.1 43.2 60.0
1.8 -1.0 1.1 2.3
151 116 85 75 67
90 67 50 45 40
291 208 159 147 130
126 90 69 64 56
196 164 114 95 86
2.5 2.9 3.0 3.2 3.7
3.7 3.7 3.8 3.9 4.5
28.8 40.6 53.3 57.8 65.7
2 4 6 8 10
11.4 20.3 32.2 41.2 61.0
1.0 2.1 2.6 2.6 -5.0
156 137 125 107 83
97 86 77 65 51
336 302 263 220 173
145 131 114 95 75
182 157 149 128 100
3.0 3.1 3.1 3.3 3.8
3.4 3.2 3.4 4.0 4.4
28.1 31.3 36.1 43.2 54.9
Wt Pct Sn
16
METALLURGICALTRANSACTIONSA
De (/~) [111] [100]
DSF (]k) [111] [100]
T "n (/~i
(e2=50A)1/2 x 103 [11
Data Loading...